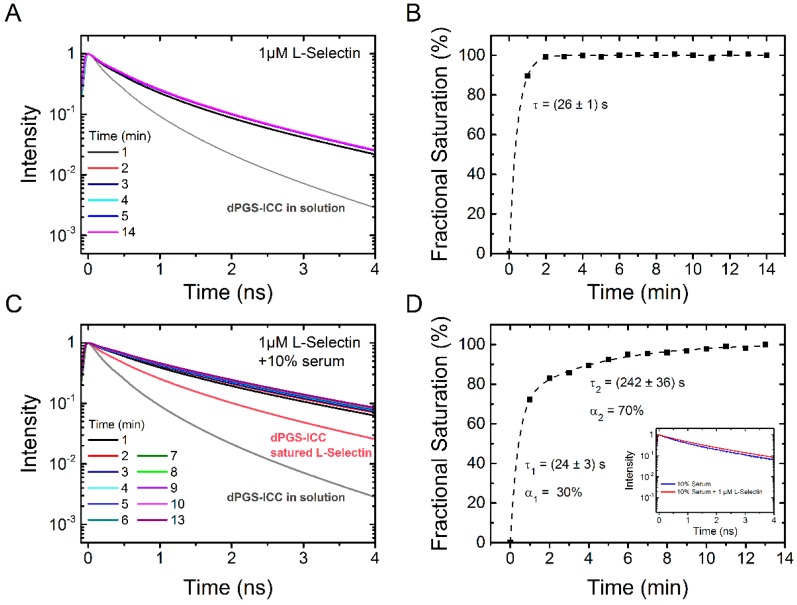
Figure 9.
Time dependence of dPGS-ICC binding to L-selectin and effect of serum. (A) Lifetime decay curves of 0.1 µM dPGS-ICC binding to 1 µM L-selectin and (B) the fractional saturation, based on the mean fluorescence lifetimes, as a function of time. The value of τ = 26 s was obtained from an exponential fit to the data (dashed line); (C) Lifetime decay curves of 0.1 µM dPGS-ICC binding to 1 µM L-selectin upon addition of human serum (final concentration: 10% serum) and (D) the fractional saturation, based on the mean fluorescence lifetimes, as a function of time. A bi-exponential fit to the data (dashed line) yielded two time constants of τ1 = 24 s and τ2 = 242 s with amplitudes of 30% and 70% respectively. Inset: fluorescence lifetime curves of dPGS-ICC in 10% serum and in 10% serum with 1 µM L-selectin.

