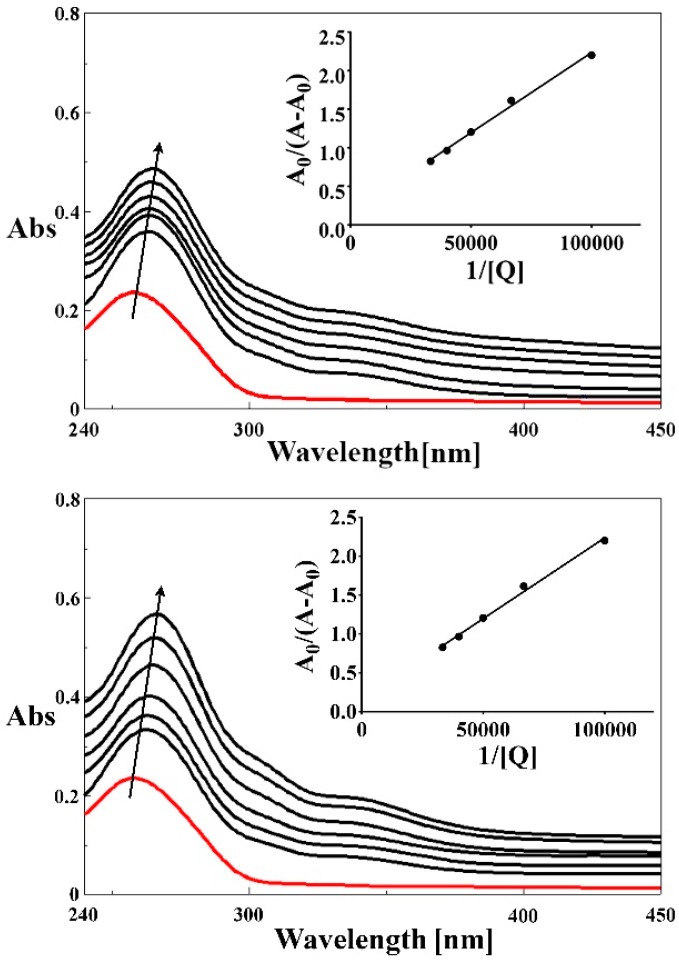
Figure 7.
Absorption spectra of DNA in the absence and presence of increasing amounts of 5-HOF and complex (2). [DNA] = 15 μM; [compound] = 0; 5; 10; 15; 20; 25; 30 μM. Insert figures represent the plots of A0/(A − A0) vs. 1/[Q]. The arrows show the absorption changes on increasing concentration of the tested compound.

