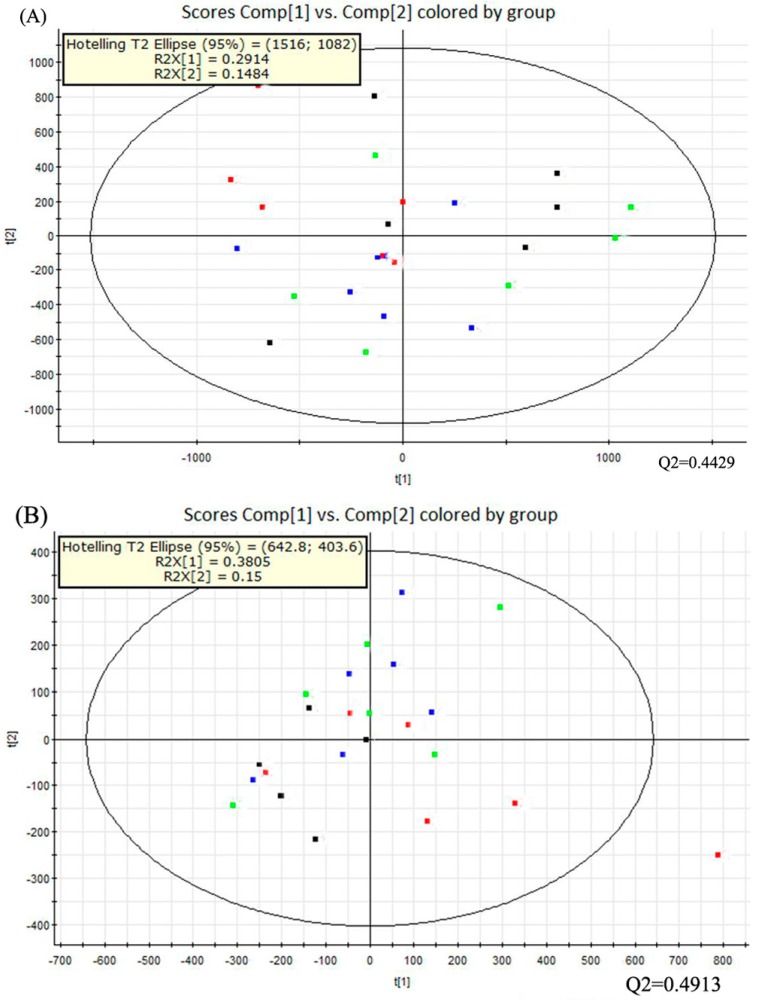
Figure 3.
PCA score plots of the four tested groups from UPLC-Q-TOF-MS profiling data. The PCA score plot showed that different liver samples were distributed into different areas; all samples were in the Hostelling T2 ellipse. (A) PCA score plot from positive ion mode; (B) PCA score plot from negative ion mode. PCA, Principal component analysis; UPLC-Q-TOF-MS, Ultra-performance liquid chromatography- quadrupole-time-of-flight-mass spectrometry. (: Dextrose control; : Alcohol control; : 0.04%NTs; : 0.16%NTs).

