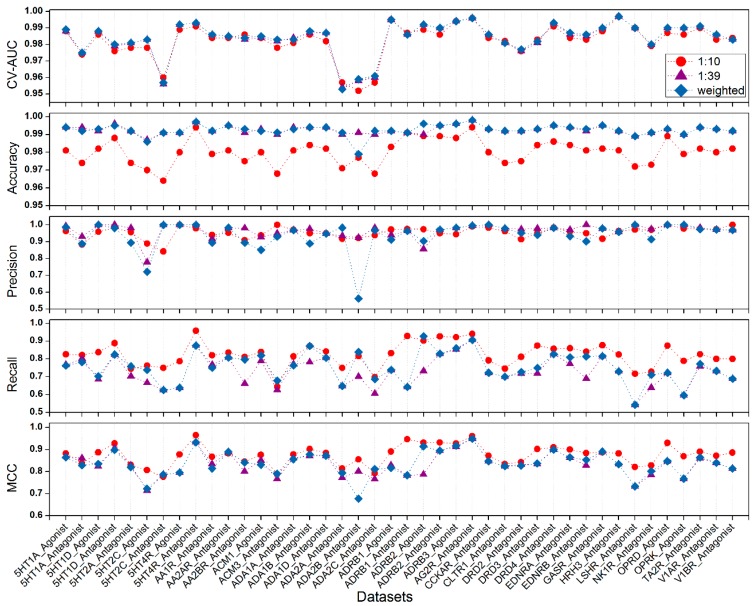
Figure 2.
Comparison of the three methods in handling the data imbalance. The red circle denotes model results based on data sets with the proportion of 1:10 (ligands:decoys). The purple triangle denotes model results based on data sets with the original ratio (1:39). The blue diamond denotes results of models with different weight for ligands class and decoys class in the SVM model training.

