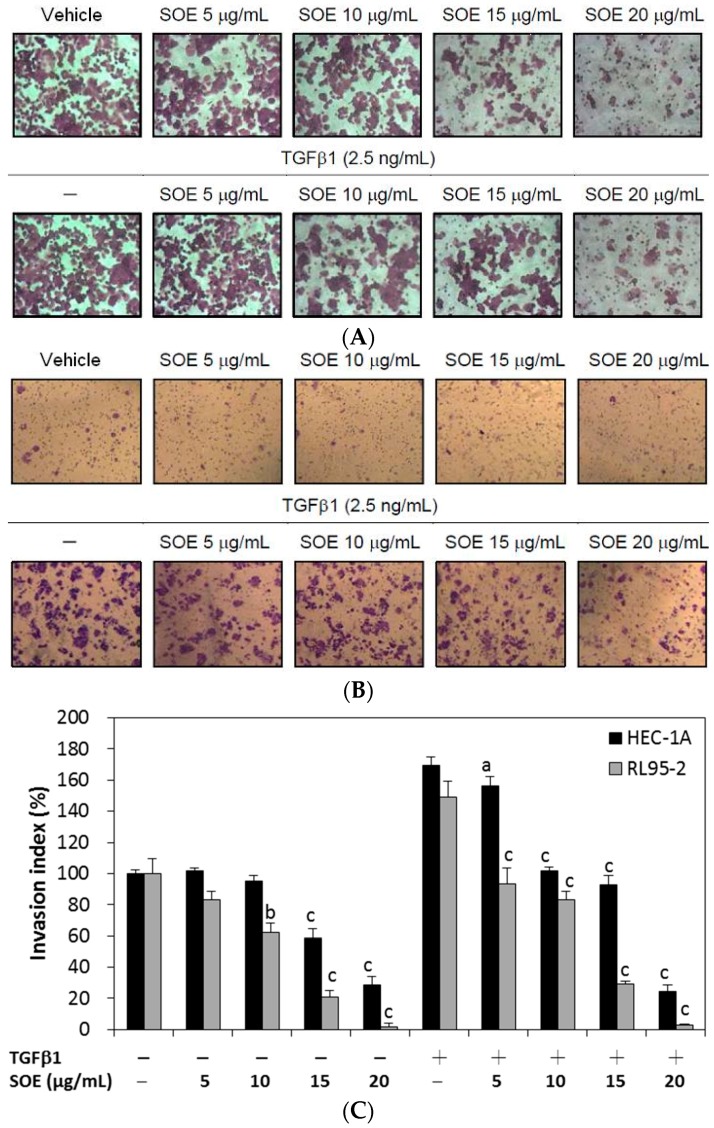
Figure 5.
Effects of SOE dose on invasion of endometrial cancer cells. (A) HEC-1A cells; (B) RL95-2 cells; and (C) the invasion index of both cell lines. The invasion assay was conducted using the Boyden chamber. HEC-1A and RL95-2 cells were treated with various doses of SOE for 48 h. Cells that penetrated the Matrigel membrane to lower surface of the filter were stained with 0.5% crystal violet. The cell numbers were visualized under an inverted microscope with a magnification of 100× and were counted per field. The invasion index is defined as 100% without TGFβ1 induction and without SOE treatment. Three independent experiments were performed; results are expressed as mean ± SD. A significant difference from the respective vehicle, according to Student’s t-test, was indicated as “a” for p < 0.05; “b” for p < 0.01; and “c” for p < 0.001.

