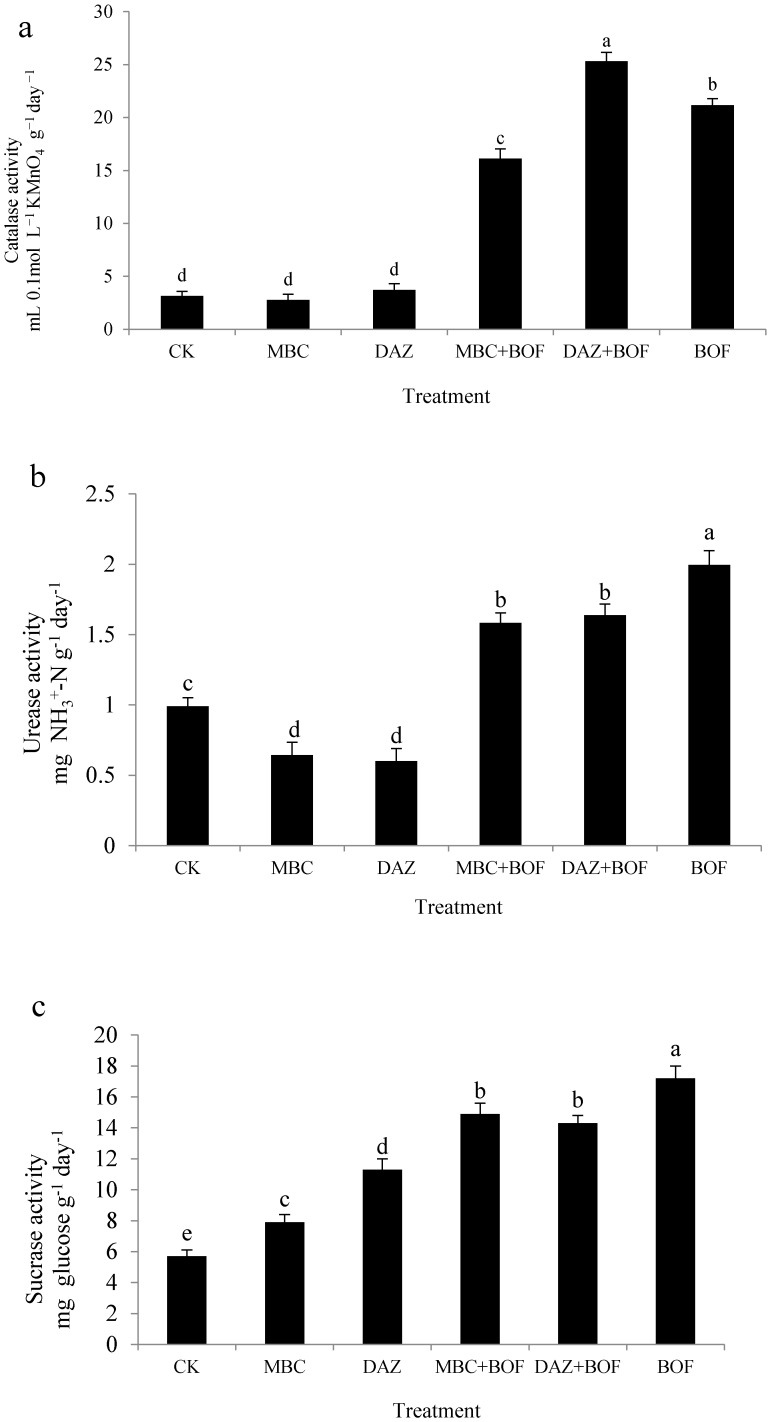
Figure 2.
Enzyme activity: (a) Catalase; (b) Urease; and (c) Sucrose in soils sampled from plants experiencing the range of treatments. The bars represent the mean and the whiskers the standard deviation. See footnote to Table 1 for the treatment codes. Letters above the bars indicate a significant difference according to Duncan’s multiple range test at p < 0.05 level.

