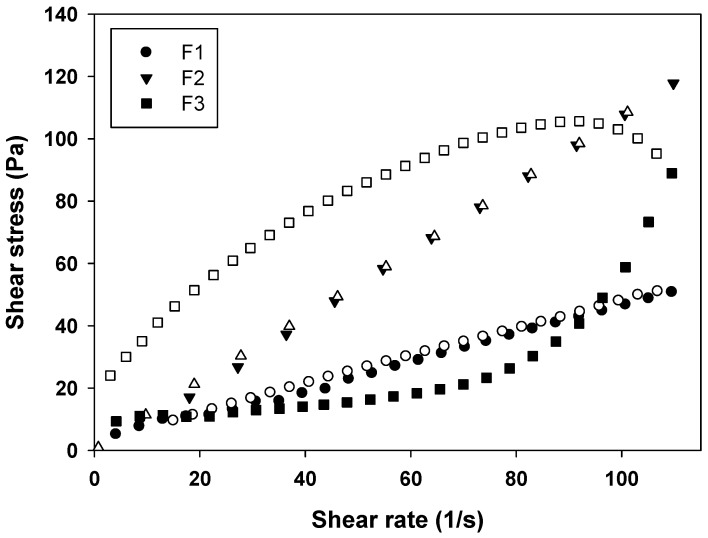
Figure 4.
Flow rheogram of F1 (●), F2 (▼) and F3 (■). Closed symbols represents the up curve and open symbols represents the down curve. Standard deviations have been omitted for clarity; however, in all cases, the coefficient of variation of triplicate analyses was less than 10%. Data were collected at 32 ± 0.5 °C.

