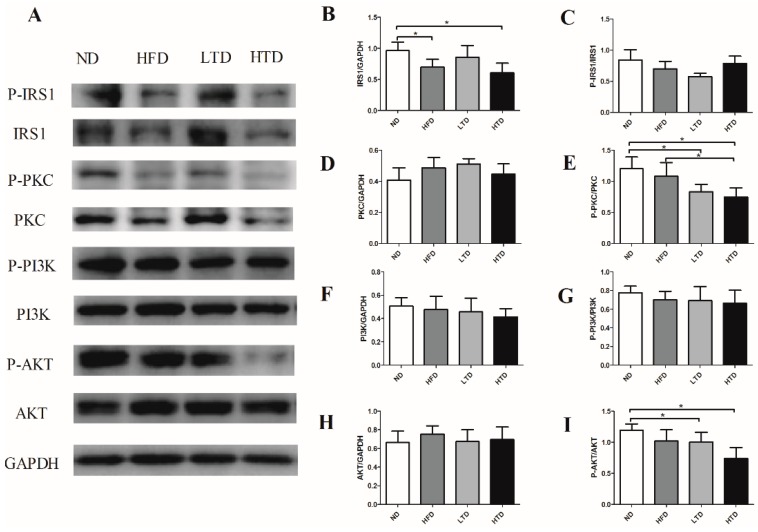
Figure 6.
Effects of trans-fatty acid on the insulin signal pathway. (A) Representative gel blots depicting proteins in the insulin signal pathway of total and phosphorylated insulin receptor substrate1 (IRS1), Protein Kinase C (PKC), Phosphatidylinositol 3-kinase (PI3K) and AKT from liver tissue after 20 weeks diet (GAPDH used as loading control) (n = 4–6 per group); (B) Total IRS1 expression (C) IRS1 phosphorylation (Ser302, P-IRS1 to total IRS1 ratio); (D) Total PKC expression; (E) PKC phosphorylation (Ser359, P-PKC to total PKC ratio); (F) Total PI3K expression; (G) PI3K phosphorylation (p85 (Tyr458)/p55 (Tyr199), P-PI3K to total PI3K ratio); (H) Total AKT expression; (I) AKT phosphorylation (Ser473, P-AKT to total AKT ratio). Data were shown as mean ± SD, *: p < 0.05.

