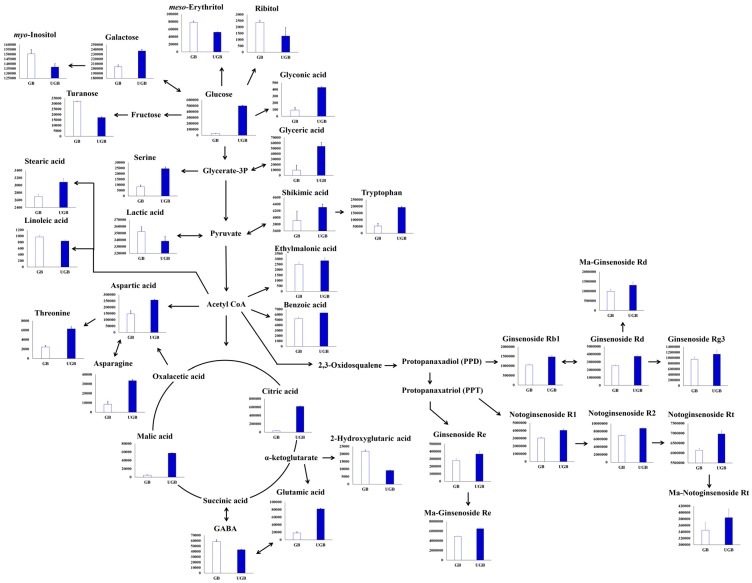
Figure 4.
Schematic representation of the relative metabolite contents visualized in respective metabolic pathways for ginseng berry samples (GB and UGB) that correspond to UHP treatments. The pathways were modified from the Kyoto Encyclopedia of Genes and Genomes (KEGG) database (http://www.genome.jp/keg/). The Y-axis of the histogram represents peak areas for respective metabolites. Data are mean values, and the error bars represent standard deviation values (n = 9). These metabolites were selected by VIP > 0.7 and p < 0.05.

