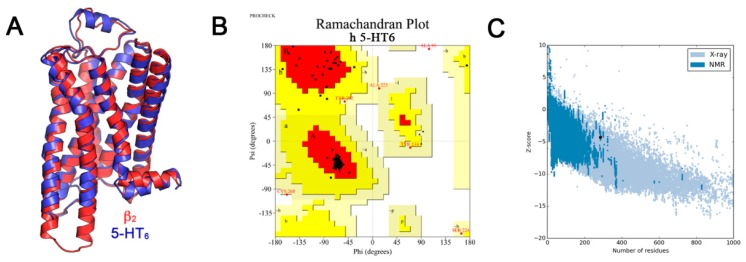
Figure 6.
Validation of the obtained 5-HT6R model. (A) Superposition of the obtained 5-HT6R model (in red) and the β2-AR structural template (in blue); (B) Ramachandran plot for the final minimized 5-HT6R model, red color indicates the most favored regions, yellow color for additional allowed regions, light yellow shows generously allowed regions and white color denotes the disallowed regions; (C) ProSA-web Z-score plot for 5-HT6R model.

