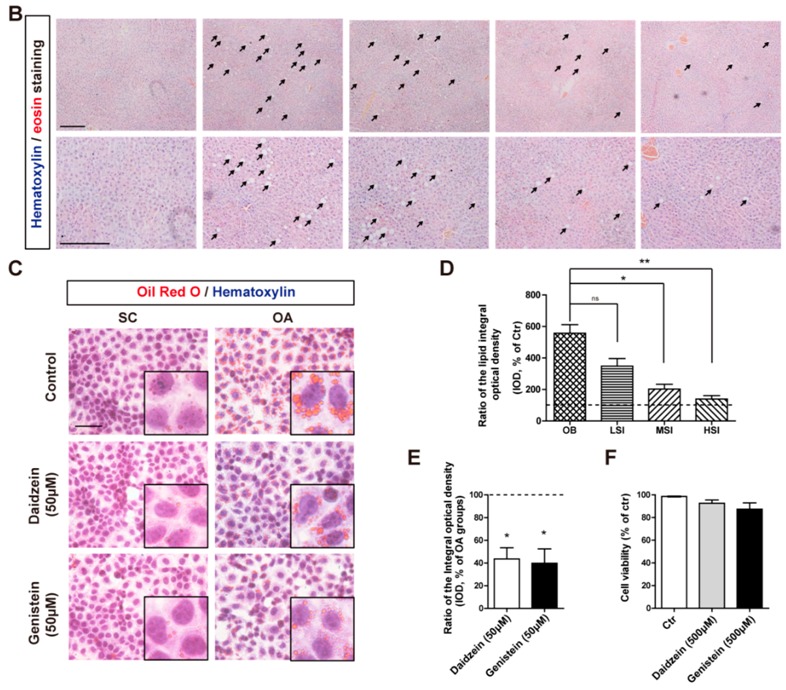
Figure 2.

Soy isoflavones suppress the lipid accumulation in vivo and in vitro. (A) Representative images of Oil Red O staining show the accumulation lipid in the liver of rats feed with different diets. The insets show enlarged lipid droplets. Bar: 50 μm; (B) Representative images of H and E staining show the steatosis (arrow indicated) in the liver of rats feed with different diets. Bar: 100 μm; (C) Representative images of Oil Red O staining show the accumulation lipid, induce by 1 mM OA for 24 h, following a 24 h daidzein and genistein treatment in HepG2 cells. SC, solvent control; OA, oleic acid. The insets show enlarged lipid droplets. Bar: 50 μm; (D) Quantification shows a significant decrease in the ratio of the lipid integral optical density between OB groups and soy isoflavone-addition groups. The dashed shows the ctr; (E) Quantification shows a significant decrease in the ratio of the lipid integral optical density in daidzein- and genistein-treated HepG2 cells. * p < 0.05, ** p < 0.01; (F) Quantification shows the cell viability of HepG2 cells treated with daidzein and genistein. Error bars indicate SEM. n = 3.

