Figure 3.
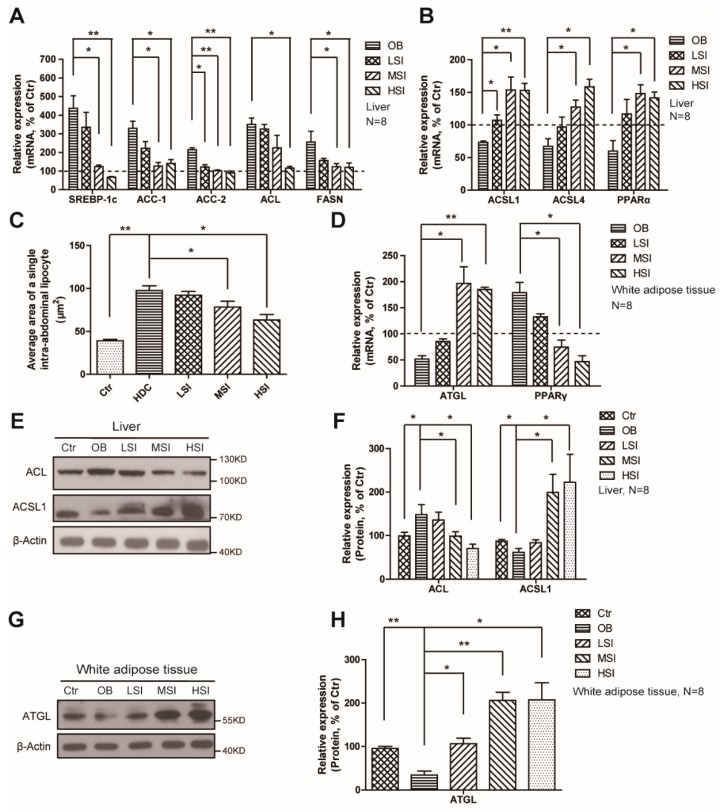
Soy isoflavones suppress lipogenesis and adipogenesis, and enhance lipolysis and β‑oxidation in DIO rats. (A) qRT-PCR shows decreased mRNA levels of the lipogenesis-related genes as indicated in liver of the soy isoflavone-fed DIO rats in comparison to the OB group; (B) qRT-PCR shows increased mRNA levels of the β‑oxidation related genes as indicated in liver of the soy isoflavone-fed DIO rats in comparison to OB group; (C) Quantification shows changes of the average area of a single intra-abdominal lipocyte in rats fed different diets; (D) qRT-PCR shows increased mRNA levels of ATGL, while a decreased mRNA levels of PPARγ, as indicated in white adipose tissue of the soy isoflavone-fed DIO rats in comparison to the OB groups; (E,F) Western blots and quantification show an increase in ACL, and a decrease in ACSL1 in the liver of the soy isoflavone- fed DIO rats in comparison to the OB group; (G,H) Western blots and quantification show an increase in ATGL in the liver of the soy isoflavone-fed DIO rats in comparison to the OB group. Error bars indicate SEM. * p < 0.05, ** p < 0.01. The dashed shows the ctr.

