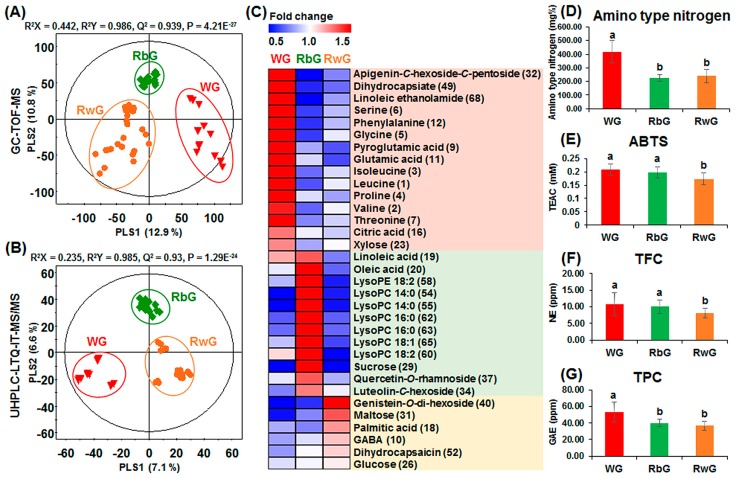
Figure 3.
Partial least square-discriminate analysis (PLS-DA) score plots using the GC-TOF-MS (A); UHPLC-LTQ-ESI-IT-MS/MS (B) data sets, heat map of specific metabolites (C); amino type nitrogen contents (D); antioxidant activity tested by ABTS (E); total flavonoid contents (TFC) (F); and total polyphenolic contents (TPC) (G) according to the type of cereal grain used in commercial gochujang; WG, wheat gochujang; RbG, brown rice gochujang; RwG, white rice gochujang. The numbers in the heat map correspond to the compound numbers presented in Table S3. Different letters in the bar graph indicate significant difference by ANOVA followed by Duncan’s multiple-range test (p-value < 0.05).

