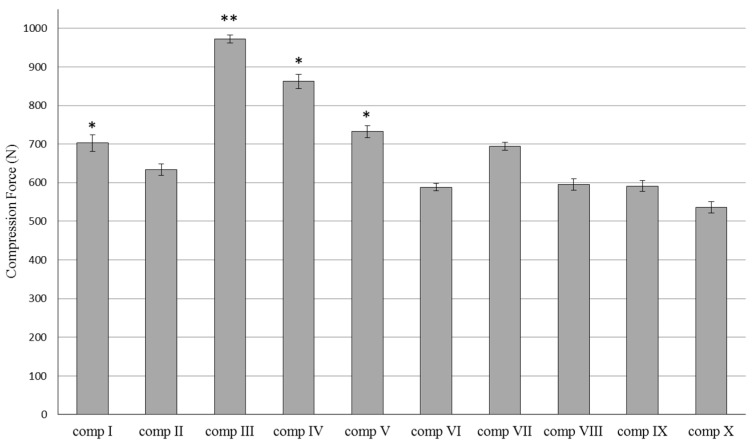
Figure 1.
Resistance of silymarin cream formulations I–X, determined as compression force (N). Each data point represents the mean ± S.D., n = 5. Repeated-Measures ANOVA and for quantifying associations between the groups, Pearson correlation had been performed. Significant differences were marked in the figure with * (p < 0.01), and ** (p < 0.1), which show the significance levels in the case of compositions containing SM in suspended or dissolved forms.

