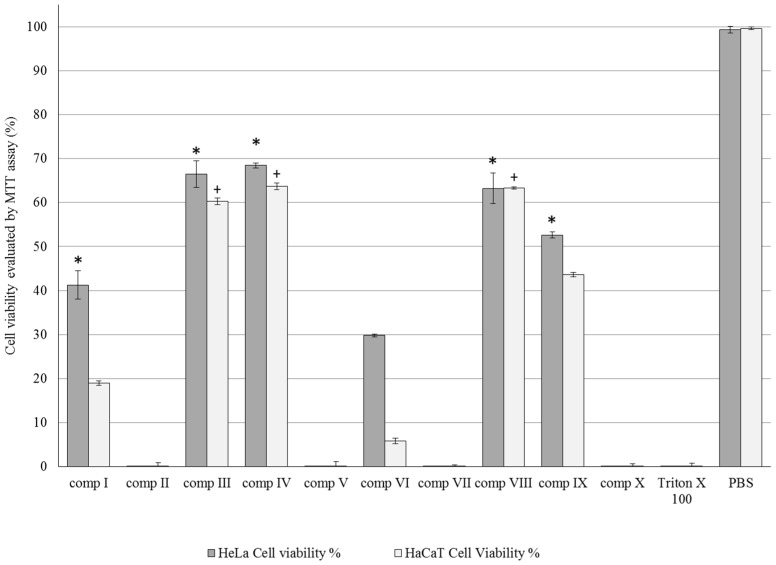
Figure 3.
Cell viability evaluation following MTT assay on HaCaT and HeLa cells treated with compositions I–X Each data point represents the mean ± S.D., n = 10. Repeated-Measures ANOVA and Pearson correlation tests were performed. Significant differences (p > 0.05) are marked with * and crosses in our designed figures. * and + show the significance levels in the case of compositions I–X compared to the positive (Triton-X) and negative (PBS) controls.

