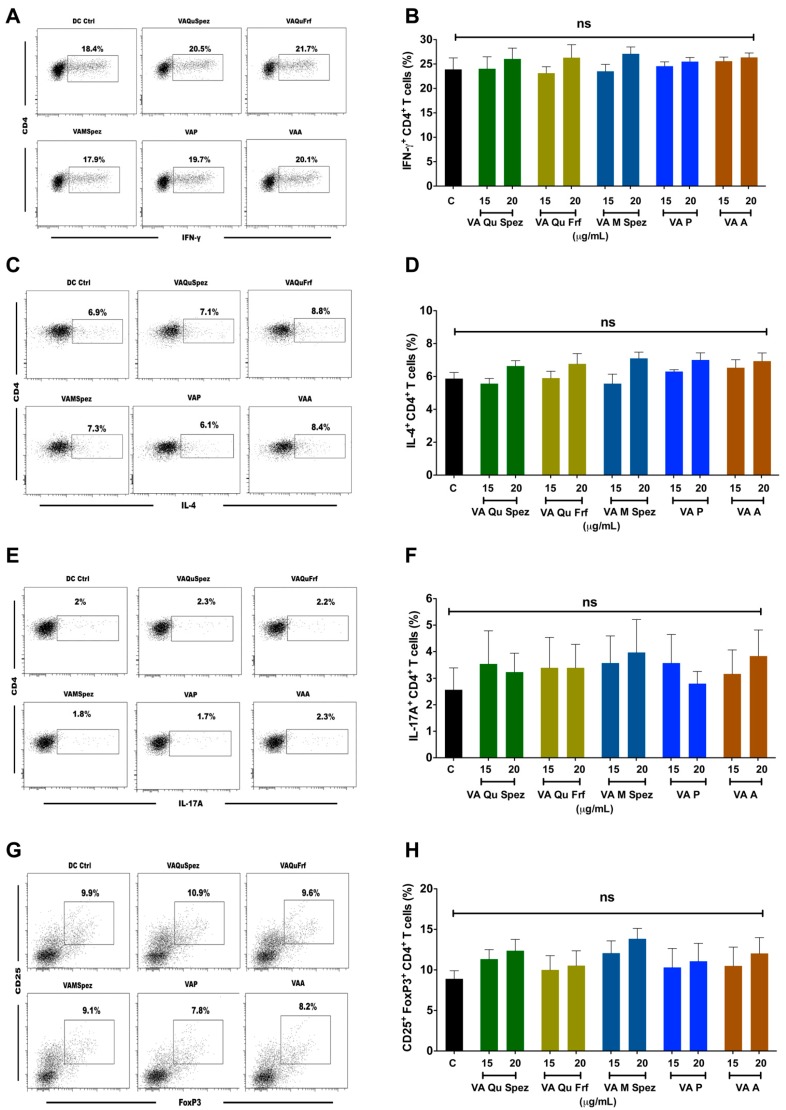
Figure 3.
Effect of various VA preparations on the CD4+ T cell responses. DCs were treated with medium alone (DC Ctrl, labelled as ‘C’) or with five preparations of VA for 48 h. These DCs were co-cultured with CD4+ T cells at 1:10 ratio. After five days of co-culture, the cells were analysed for the various CD4+ T cell subsets by intra-cellular cytokines (IFN-γ, IL-4, IL-17A) or transcription factor (FoxP3) for Th1, Th2, Th17 and Tregs respectively. (A,C,E,G) representative dot plots showing the proportion of IFN-γ+, IL-4+, IL-17A+ CD4+ T cell and CD4+CD25+Foxp3+ T cells respectively; (B,D,F,H) Percentage (mean ± SEM, six independent donors) of IFN-γ+ Th1, IL-4+ Th2, IL-17A+ Th17 and CD4+CD25+Foxp3+ Treg cells respectively. ns, non-significant.

