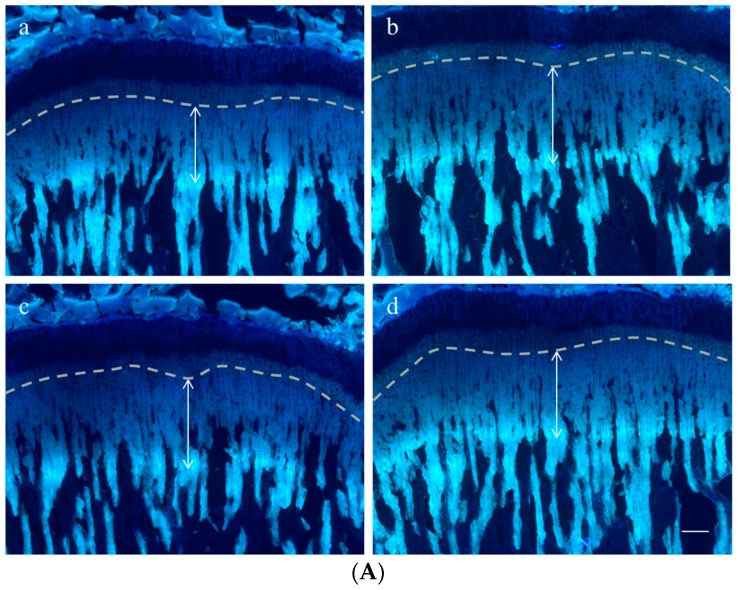
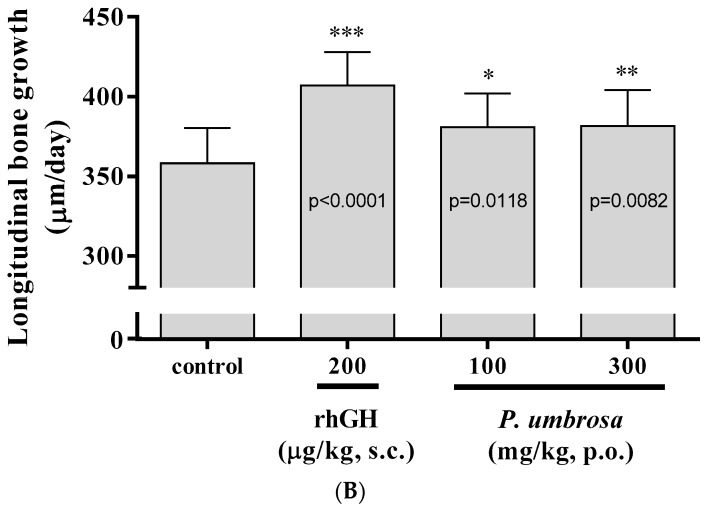
Figure 2.
(A) Representative fluorescence photomicrographs of sagittal sections of the proximal tibial growth plate in rats. The double-headed arrow shows the distance between the chondro-osseous junction within the growth plate and the proximal endpoint of the tetracycline label which indicates the length of bone growth in proximal tibial growth plate during 72 h period. (a) vehicle treated control group; (b) rhGH 200 μg/kg (s.c.) treated group; (c) P. umbrosa 100 mg/kg (p.o.) treated group; (d) P. umbrosa 300 mg/kg (p.o.) treated group. The scale bar is 200 μm; (B) Effects of P. umbrosa on longitudinal bone growth rate in proximal tibial growth plate. Each value is the mean ± SD. The number of animals is 14–21 per group; * p < 0.05, ** p < 0.01 and *** p < 0.001 vs. control (one-way ANOVA, Bonferroni test).


