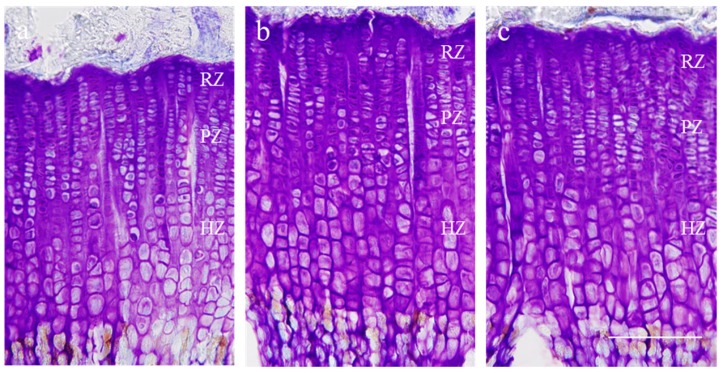
Figure 3.
Representative photomicrographs of cresyl violet-stained chondrocytes of the proximal tibial growth plate in rats. (a) vehicle treated control group; (b) rhGH 200 μg/kg (s.c.) treated group; (c) P. umbrosa 300 mg/kg (p.o.) treated group, RZ: resting zone, PZ: proliferative zone, HZ: hypertrophic zone. The scale bar is 200 μm.

