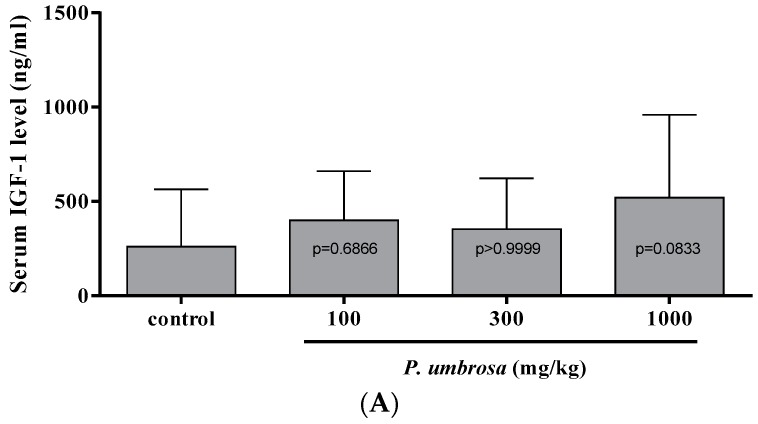
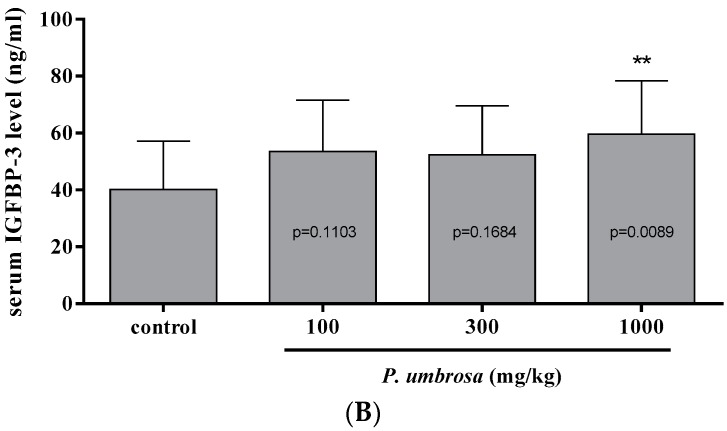
Figure 6.
(A) Serum insulin-like growth factor-1 concentration for each group at 12 h after treatment; (B) Serum insulin-like growth factor binding protein-3 concentration for each group at 12 h after treatment. Each value is the mean ± SD. The number of animals is sixteen per group; ** p < 0.01 vs. control (one-way ANOVA, Bonferroni test).


