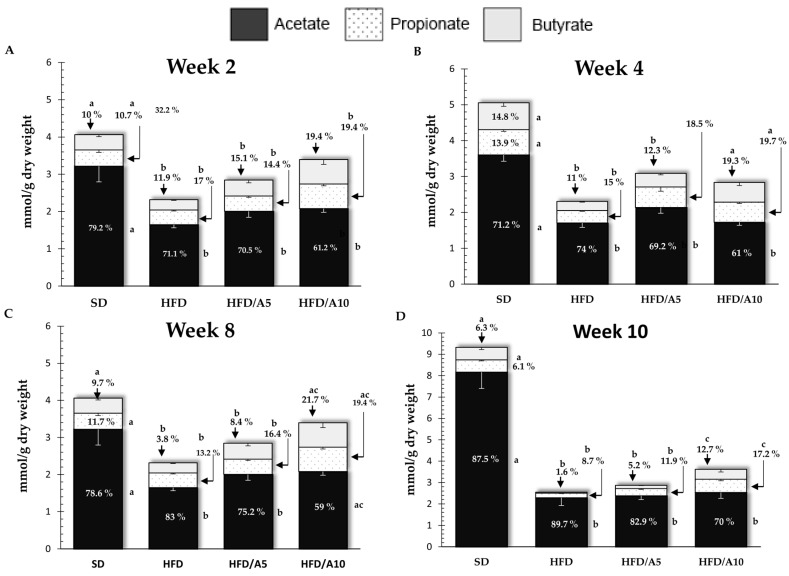
Figure 2.
Total fecal mice SCFAs levels at (A) 2 weeks, (B) 4 weeks, (C) 8 weeks and (D) 10 weeks. SD, standard diet; HFD, high-fat diet; HFD/A5, high-fat diet supplemented with 5% agavins; HFD/A10, high-fat diet supplemented with 10% agavins. One-way ANOVA and Tukey contrasts were performed to establish differences among groups. The data are represented as the mean with their standard errors of the mean (SEM). N = 10. Mean values with unlike letters (a,b,c) were significantly different (p < 0.05).

