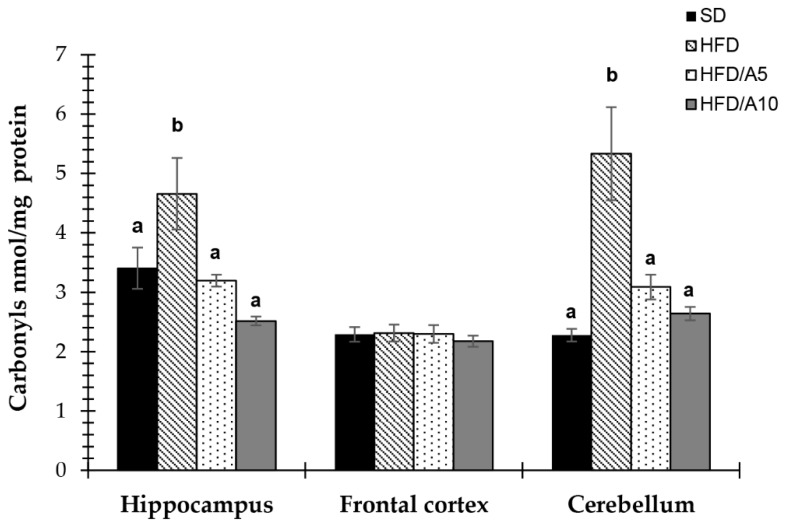
Figure 6.
Effects of fructans on protein carbonyls levels in the hippocampus, frontal cortex and cerebellum of mice fed with standard diet (SD); high-fat diet (HFD); high-fat diet with agave fructans 5% (HFD/A5); high-fat diet with agave fructans 10% (HFD/A10). One-way ANOVA and Tukey contrasts were performed to compare differences among groups. The data are represented as the mean with their standard errors of the mean (SEM). N = 10. Mean values with unlike letters (a,b) were significantly different (p < 0.05).

