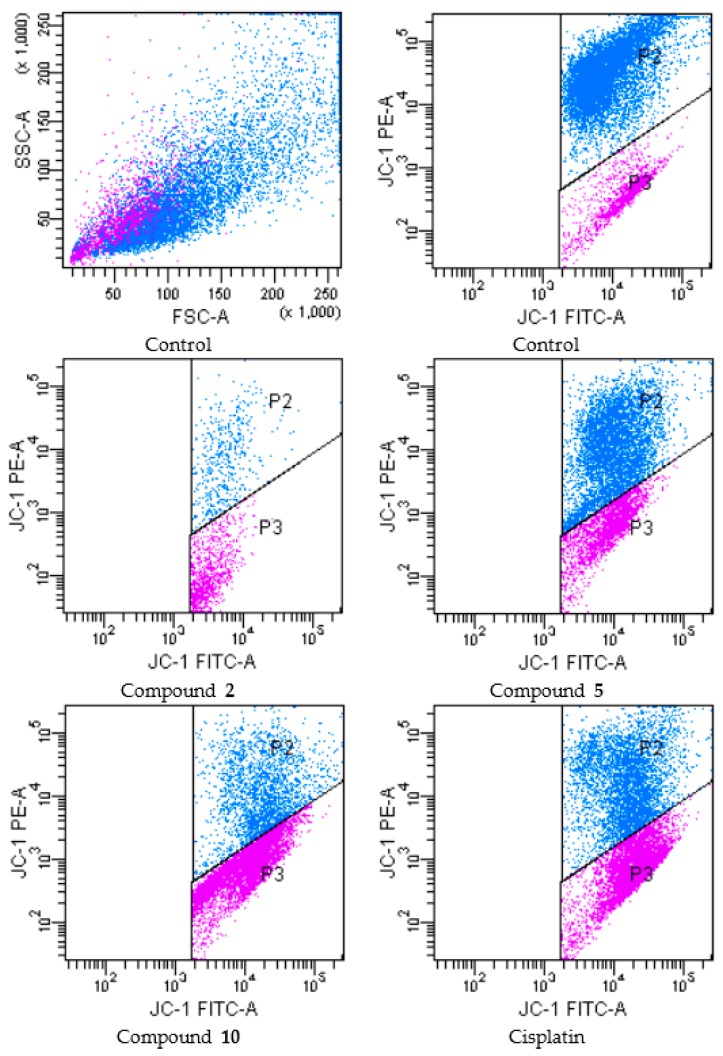
Figure 4.
The reduction of the mitochondrial membrane potential in A549 cell line by the compounds. The cells treated or untreated with the IC50 doses of the compounds for 24 h were stained with the mitochondrial-selectivite JC-1 dye and analyzed by flow cytometry. P2: mitochondrial membrane polarized cells, P3: mitochondrial membrane depolarized cells.

