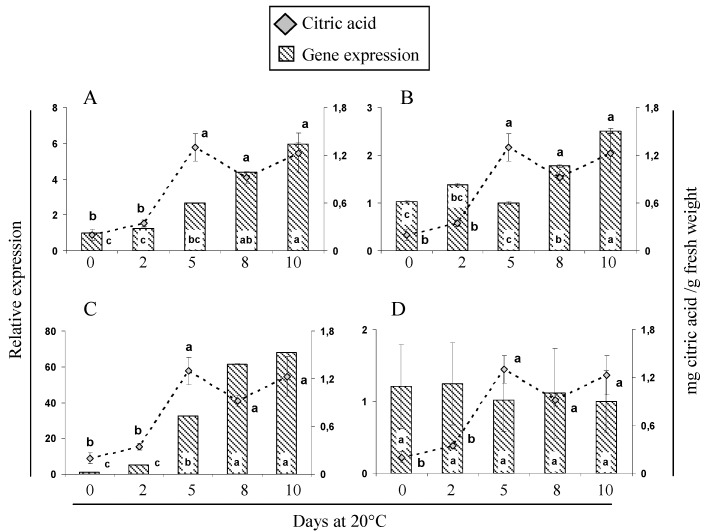
Figure 4.
Expression profiles of putative genes related to the synthesis or degradation of citric acid during ripening of cherimoya cv. “Concha Lisa”. The following genes were analyzed by qPCR: (A) citrate synthase, Ac-mCS; (B) aconitate hydratase 1, AcACON; (C) ATP citrate synthase, AcATP-CS; and (D) NADP-dependent isocitrate dehydrogenase, AcNADP-IDH. Expression was normalized to the reference gene AcUbiq (GenBank FJ664263) and the value is expressed against the lowest value of relative abundance. In each panel, gene expression (bars) was compared with the concentration of citric acid (gray rhombus). Different letters between each time point represent significant differences at p ≤ 0.05 by the LSD test.

