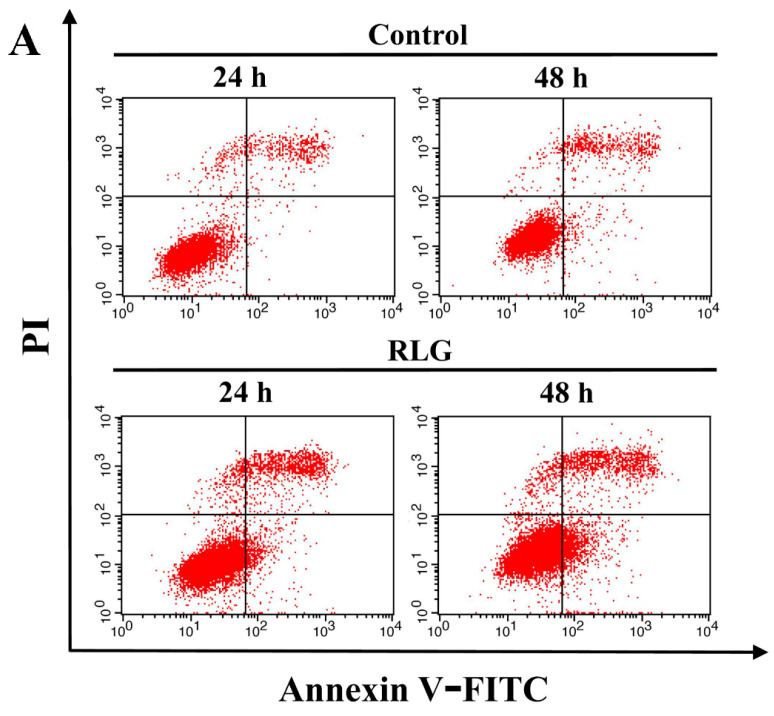
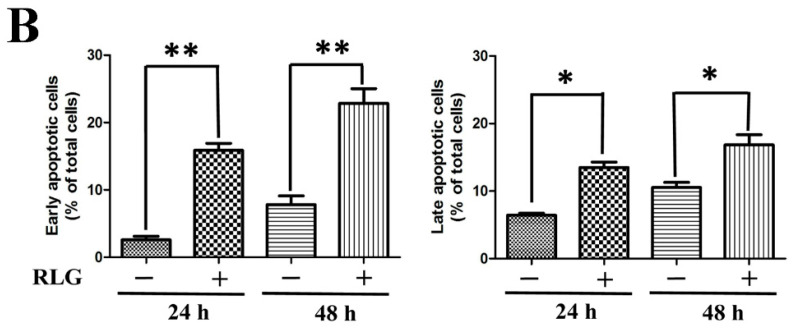
Figure 4.
Riligustilide induced apoptosis against HCT-8 cells. (A) Representative apoptotic profile of HCT-8 cells treated with 10 μM RLG for 24 and 48 h by flow cytometry assay; (B) Statistical analysis of cell apoptotic rate after the treatment of RLG. The data are expressed as the means ± S.D. of three independent experiments with similar results. Student’s t-test was used for two group comparison. * p < 0.05; ** p < 0.01 vs. the control. “+” represents that 10 μM RLG was added, “−” represents control.


