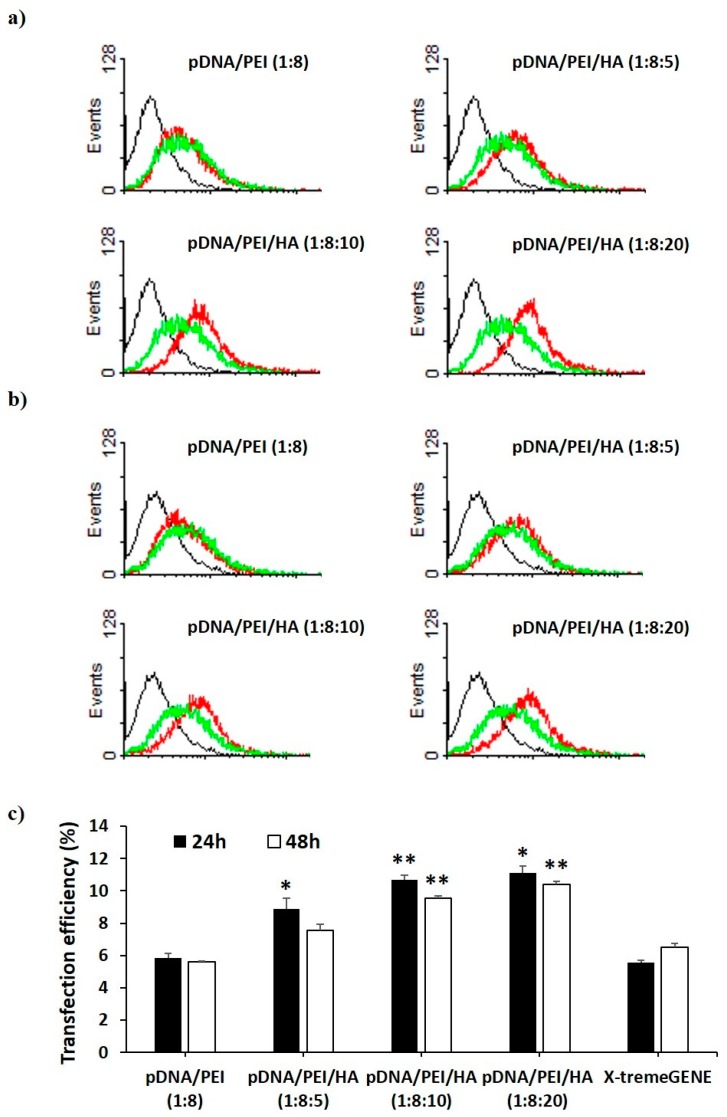
Figure 5.
Flow cytometry profiles of non-transfected hASCs (black) and hASCs transfected with pCXLE-EGFP using each nanocomplex (red) and X-tremeGENE (green) (a) at 24 h and (b) 48 h after treatment. Black line = control, red line = complex, green line = X-tremeGENE; (c) Percentage of EGFP-expressing hASCs after transfection by each nanocomplex. Data are presented as means ± S.E. (n = 4), * p < 0.05, ** p < 0.01 vs. X-tremeGENE.

