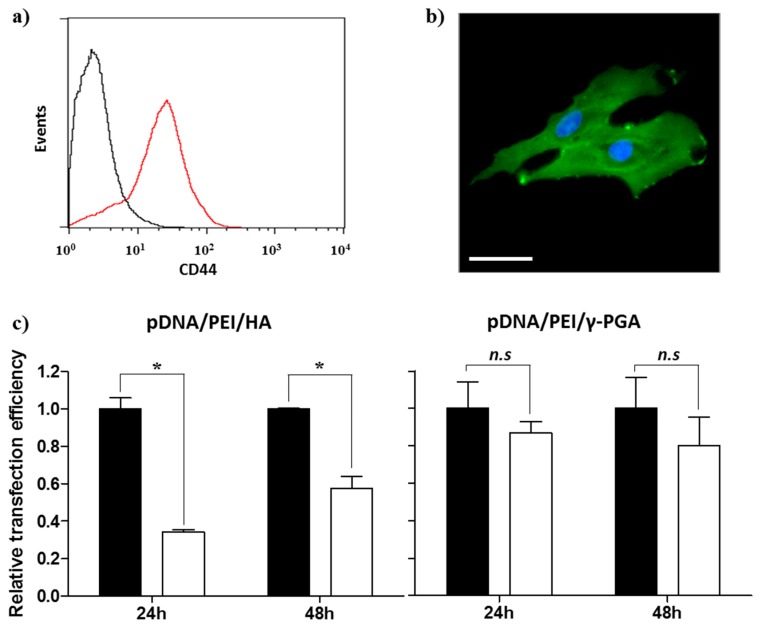
Figure 7.
Expression of CD44 in hASCs evaluated by (a) flow cytometry and (b) fluorescence image. Scale bar = 40 µm. (c) Competition assay to investigate the effect of HA pretreatment on the transfection efficiency of pDNA/PEI/HA (left) and pDNA/PEI/γ-PGA (right) ternary nanocomplexes at 24 or 48 h. ■ = without HA pretreatment, □ = with HA pretreatment. Data are presented as means ± S.E. (n = 4), * p < 0.05, n.s = not significant vs. untreated control.

