Figure 1.
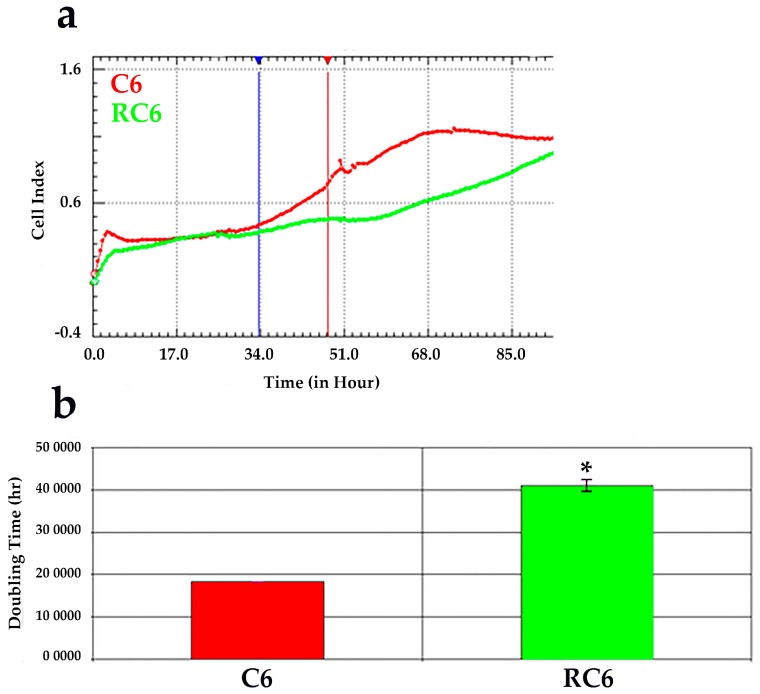
Real time analysis of proliferation of C6 and RC6 cells using E-plate. The rate of proliferation was monitored using the xCELLigence system. (a) Representative graph comparing the Cell Index (CI) of C6 (red line) and RC6 cell line (green line); (b) Doubling time of C6 and RC6 cell line determined by analyzing the cell growth in logarithmic phase between 34 h and 48 h time points. The average ± SEM obtained from three independent experiments (n = 3) are presented. Statistical significance is expressed as p < 0.05 (*).

