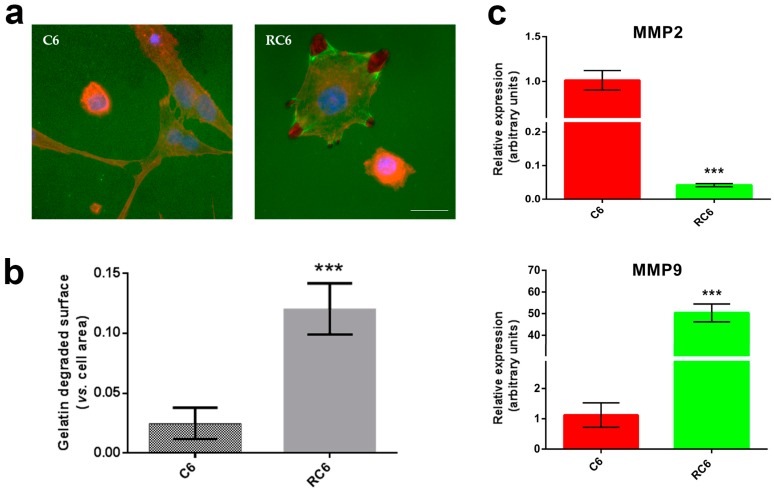
Figure 2.
Gelatin degradation activity of C6 and RC6 cells. (a) Cells were plated on Oregon Green® 488 Conjugate Gelatin for 24 h and afterwards stained with Hoechst 33342 (blue) and ActinRed 555. Areas of gelatin degradation appear as dark spots in the fluorescent background beneath the cells. Scale bar = 200 μm; (b) Quantification of degraded surface of Oregon Green® 488 Conjugate Gelatin per total area of cells. The average ± SEM obtained from three independent experiments (n = 3) are presented. Statistical significance is shown as p < 0.001 (***); (c) Real-time qRT-PCR analysis was applied to assess MMP2 and MMP9 mRNA expression. As an internal control, β-actin mRNA expression was used (n = 3). Statistical significance is presented as p < 0.001 (***).

