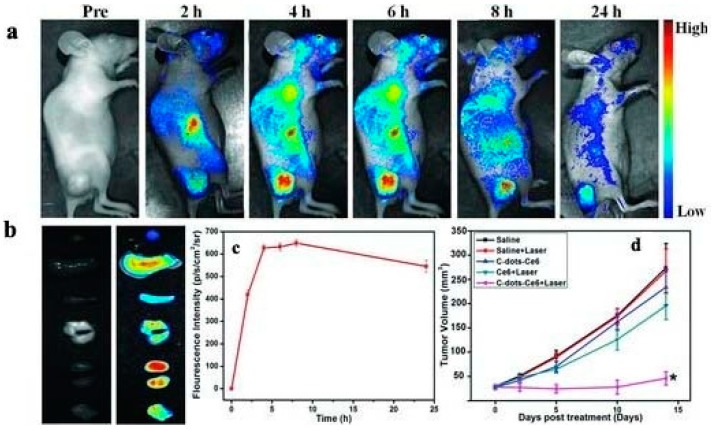
Figure 7.
(a) Real-time in vivo NIR fluorescence images following intravenous injection of CDot-Ce6 into nude mice at different time points; (b) ex vivo tissue images (from top to bottom: heart, liver, spleen, lung, kidney, and tumor); (c) the fluorescence intensities in the tumor region during a 24-h period post-injection (n = 5); (d) MGC803 tumor growth curves upon specified treatments (n = 5). (* p < 0.05 for the C-dots-Ce6 + laser group vs. all other groups). Image adapted with permission from [144].

