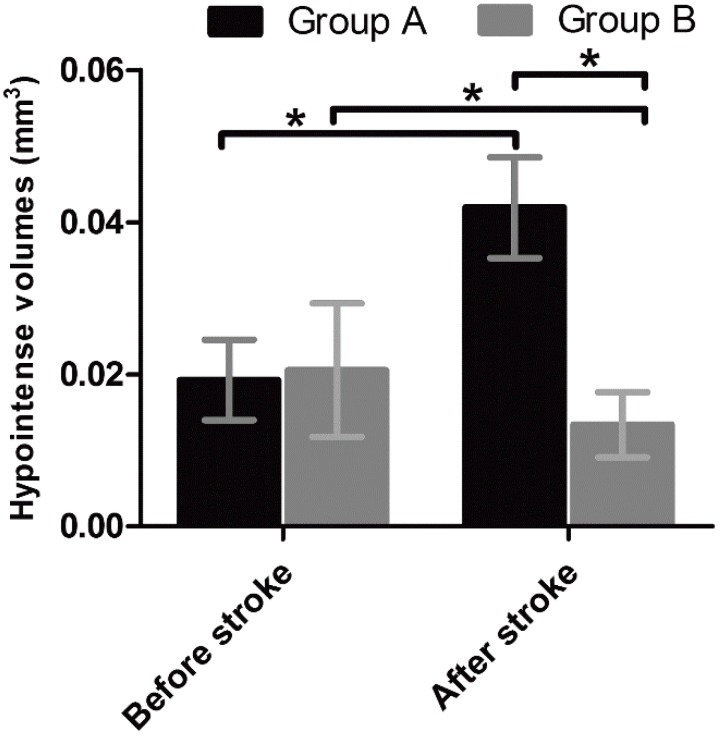
Figure 2.
Volumes of hypointense signals in the SVZ and RMS in pure stroke mice and stroke mice treated with Ara-C. Graphs show the volumes of hypointense signal measured in the SVZ and RMS on T2*-weighted MR images in pure stroke mice (group A) and stroke mice treated with Ara-C (group B) before induction of stroke and eight days after the stroke. * p < 0.05.

