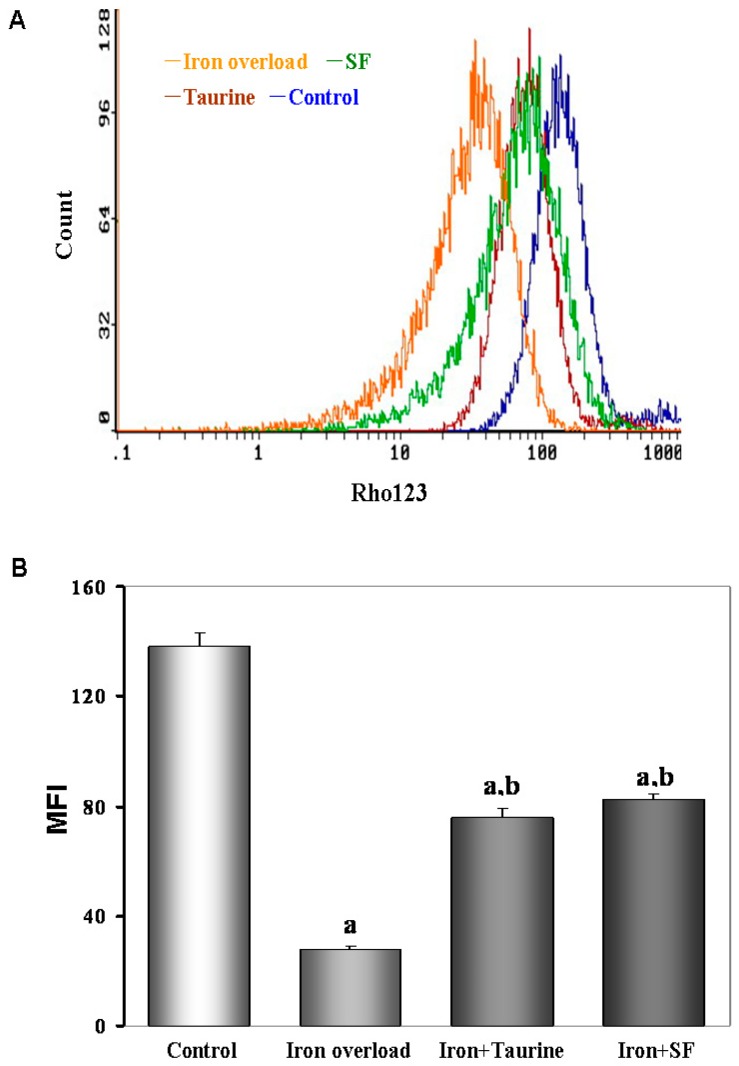
Figure 6.
The effects of TAU or SF on mitochondrial membrane potential (MMP) in iron-overloaded mice. (A) Fluorescent indicator Rhodamine123 was used to detect the change of MMP in different gourps. The fluorescent distribution curve shifted to the left in iron overload group, indicating a reduction of MMP. However, the curve shifted to the right in the cells treated with ST or TAU; (B) Quantitative analysis of mean fluorescence intensity (MFI) of Rhodamine123. Data represents mean ± SE of 12 independent experiments. a: p < 0.01, vs. control group; b: p < 0.01, vs. iron overload group.

