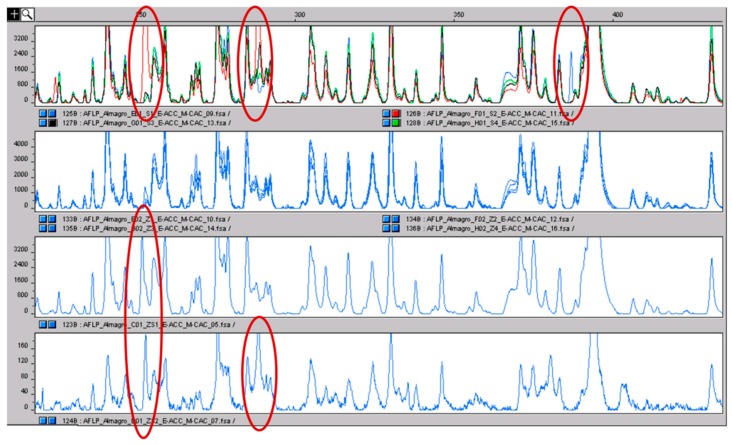
Figure 6.
In the upper panel, the AFLP profiles of the four pools of stamens are shown in different colors. The polymorphic peaks are clear and evidenced with the red circle. The second panel shows the profiles of the four pools of stigmas coming from the same accessions from which the stamens were sampled: the color is equal because no inter-pool differences were present. In the last two panels, the profiles of two stigma-stamen mixtures are shown. The polymorphisms of the stamens, absent in stigmas, can be detected (red circles). The fact that the same polymorphisms were detected by repeating the analysis is a clear indication that they are true polymorphisms and not just false positives.

