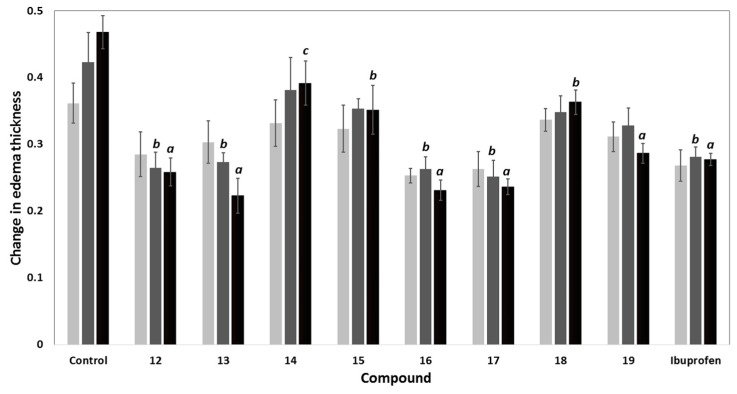
Figure 4.
Change in edema thickness using carrageenan-induced rat paw edema mode of compounds 12–19 at 1 h (), 2 h () and 3 h () after induction of inflammation; data expressed as mean ± SEM, (n = 6); data were analyzed by One way ANOVA followed by student-Newman-Keuls multiple comparison test; a statistically significant from control (p < 0.001); b statistically significant from control (p < 0.01); c statistically significant from control (p < 0.05).

