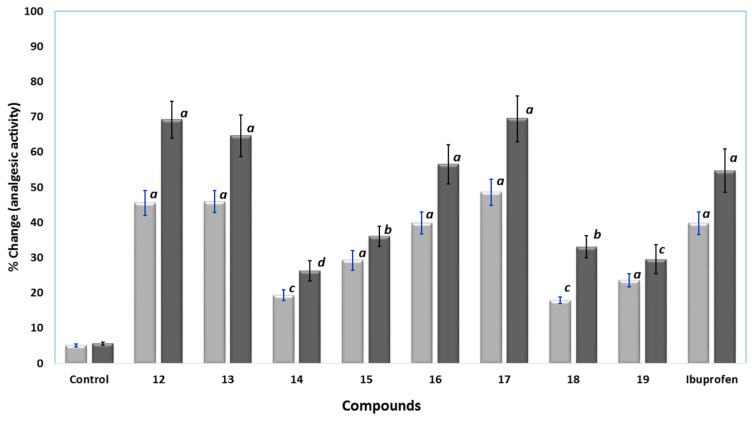
Figure 6.
The analgesic activity results using hot-plate test for control, compound 12–19, and ibuprofen at 0.24 () and 0.48 mmol/kg (); data were represented as means ± SEM, n = 6; data were analyzed by One way ANOVA followed by student-Newman-Keuls multiple comparison test; % change = 100 × (T1 − T0)/T0; a statistically significant from control (p < 0.001); b statistically significant from control (p < 0.01); c statistically significant from control (p < 0.05); d statistically not significant from control.

