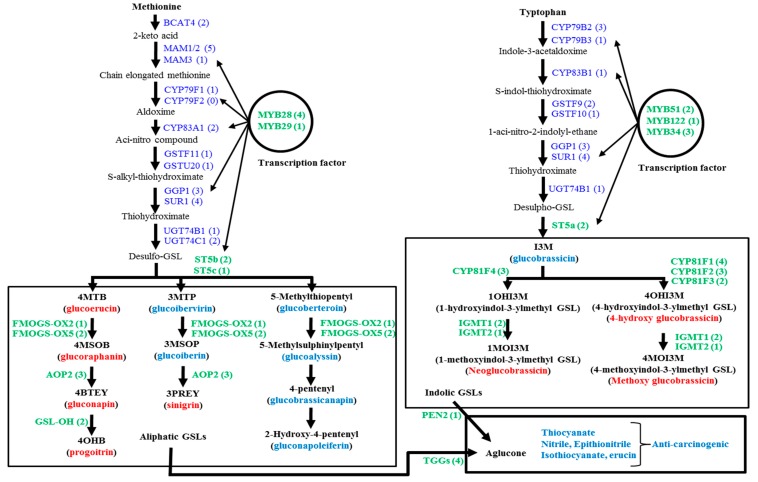
Figure 1.
Metabolic pathways involved in the biosynthesis of aliphatic and indolic glucosinolates (GSL) after Liu et al. [10], along with the related genes of B. oleracea. The GSL molecules measured by HPLC are denoted as red bold (see Table S1 for their chemical structure names). The relative expression level of green bold genes was measured by qPCR. Numbers in parentheses denote the number of genes involved in this process (Adopted from Yi et al. [5]).

