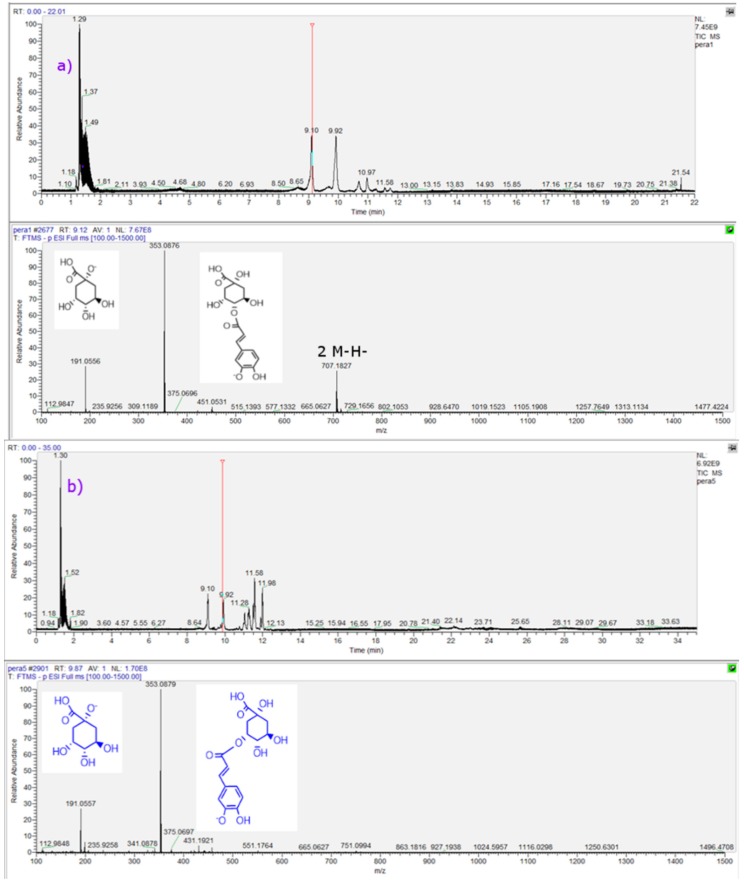
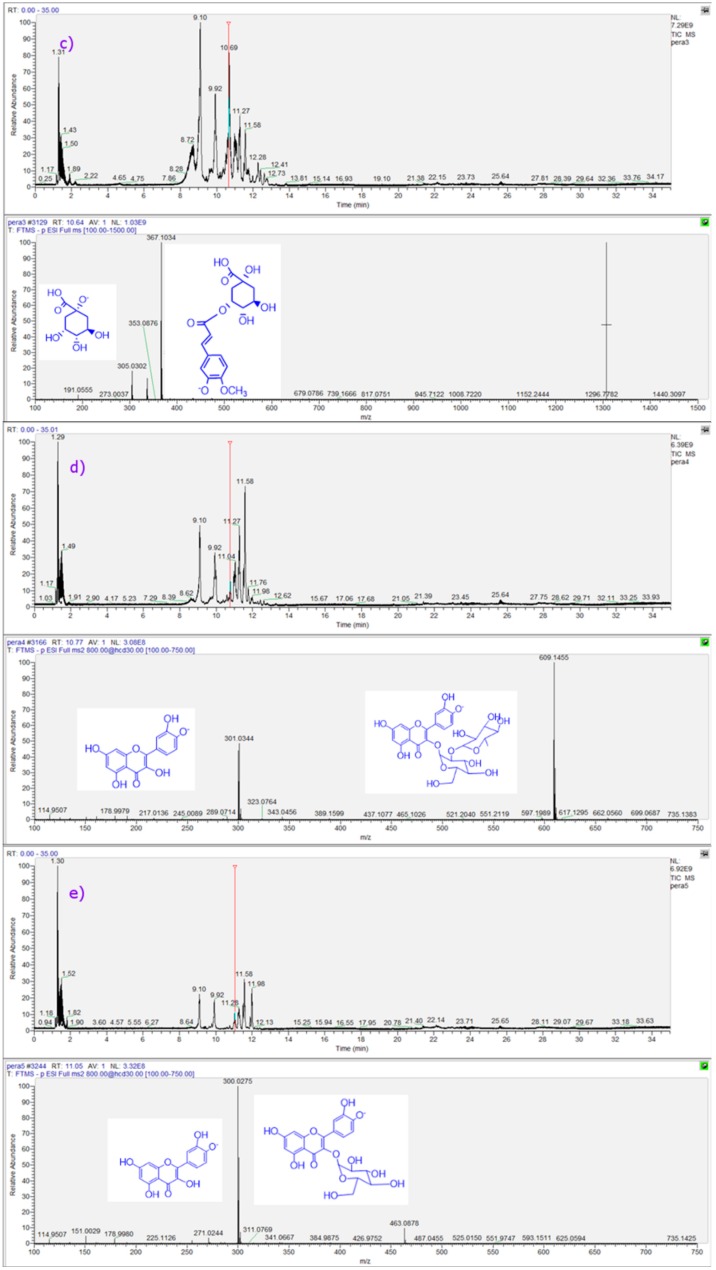
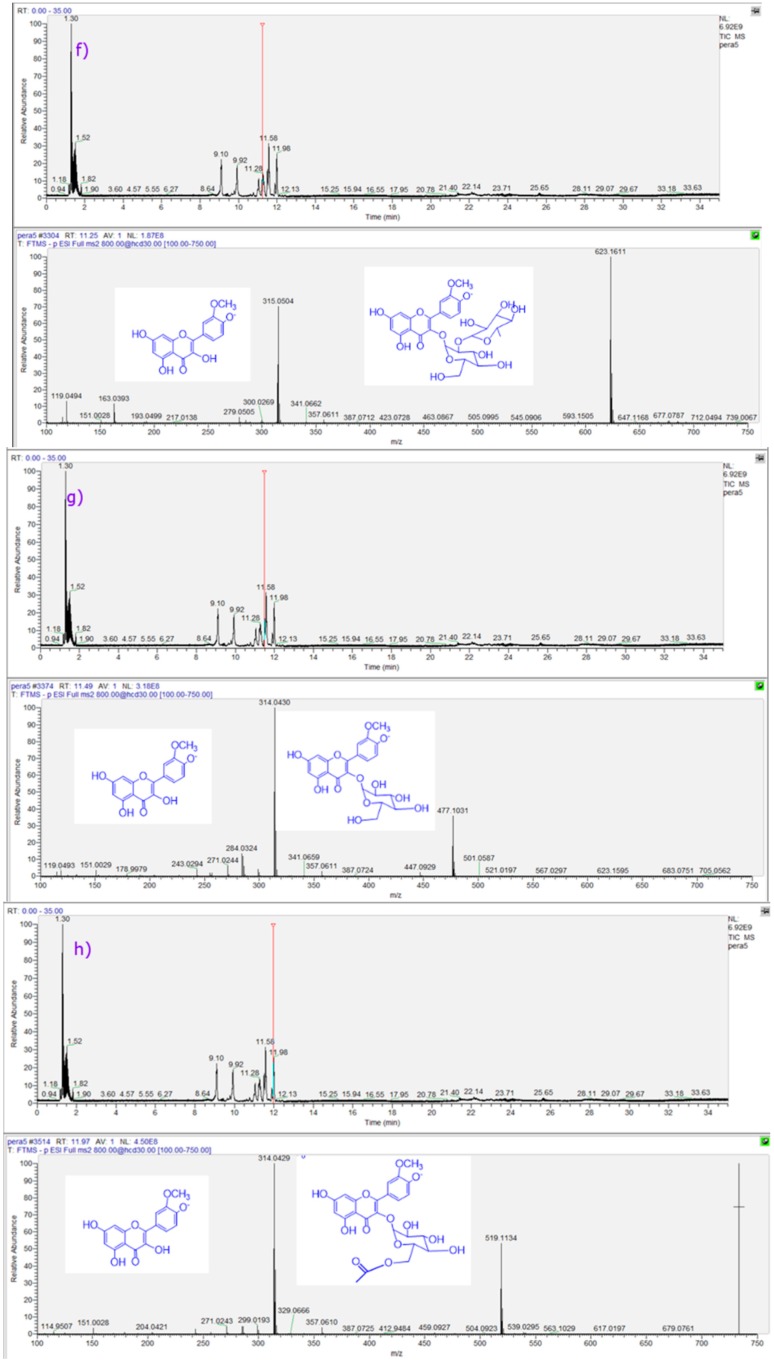
Figure 4.
UHPLC-TIC (ultra HPLC total ion current) chromatograms and full scan OT-MSn spectra of some representative compounds identified in three pear fruits cultivated in Chile. (a) peak 4; (b) peak 8; (c) peak 10; (d) peak 11; (e) peak 12; (f) peak 13; (g) peak 16; and (h) peak 21. Peak numbers refer to those indicated in Table 1.


