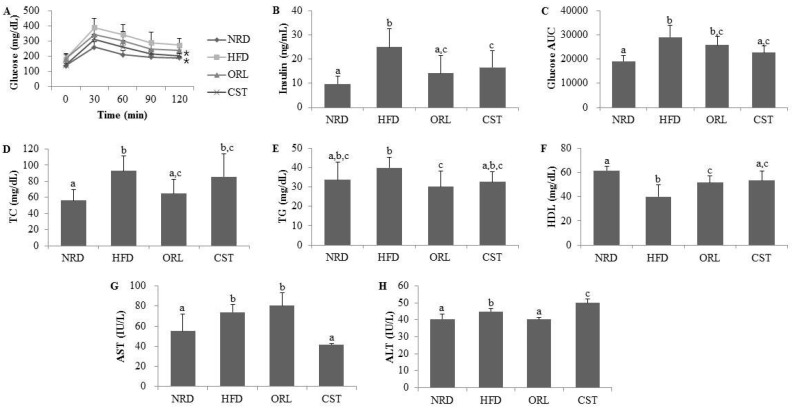
Figure 2.
Impact of CST on the glucose tolerance, insulin and other vital metabolic parameters: (A) Blood glucose level; (B) Insulin level; and (C) Area under the curve (AUC) in oral glucose tolerance test (OGTT); (D) Total cholesterol (TC); (E) Triglyceride (TG); (F) High-density lipoprotein (HDL); (G) Aspartate transaminase (AST); and (H) Alanine transaminase (ALT). Data represented the mean ± SD (n = 6). Different letters above bars indicate significant difference from each other at p < 0.05 as determined by one-way ANOVA with Least Significant Difference (LSD) post hoc test. * indicates statistical significance compared with HFD group at p < 0.05.

