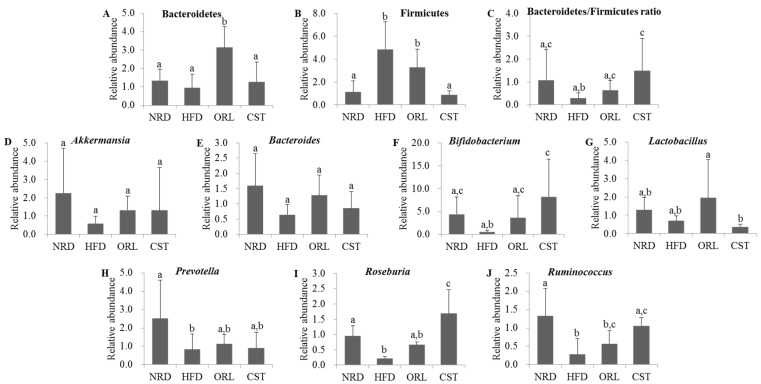
Figure 5.
Relative abundance of related microbes in mice fecal samples: (A–C) The relative abundance of phyla; and (D–J) the relative abundance of genus of microbiota in the stool samples of mice as reflected by microbial 16sRNA gene expression. The results are expressed as normalized fold values relative to the normal group. Data represented as mean ± SD (n = 5). Different letters above bars indicate significant difference from each other at p < 0.05 as determined by one-way ANOVA with Least Significant Difference (LSD) post hoc test.

