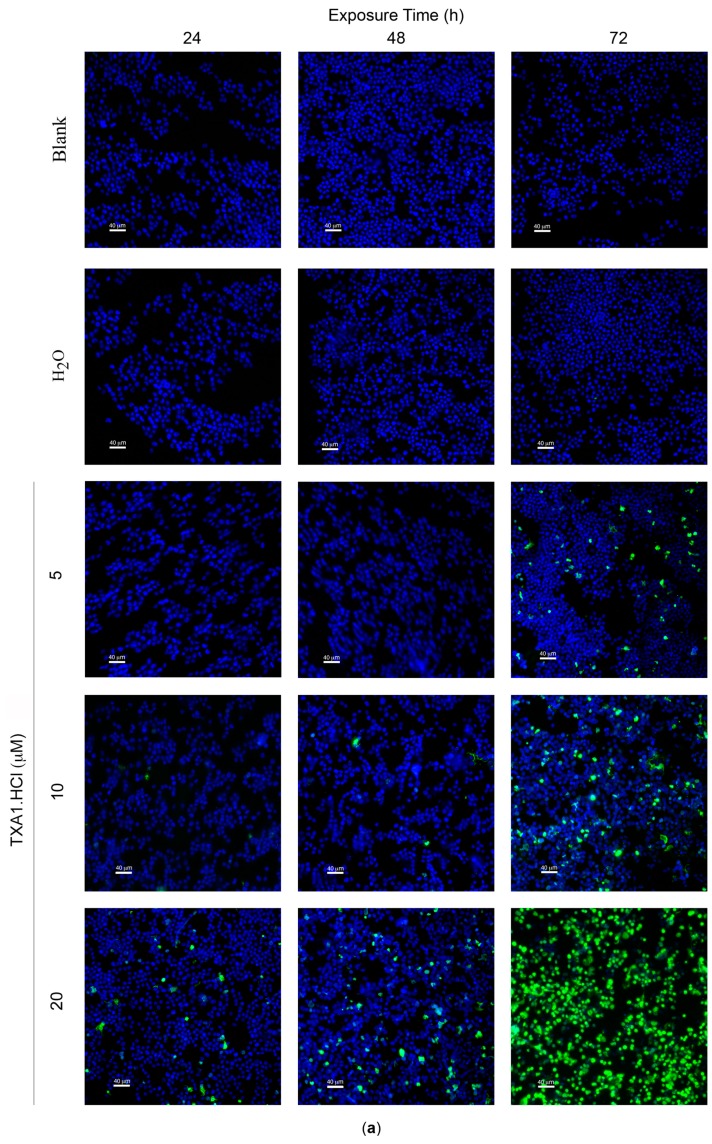
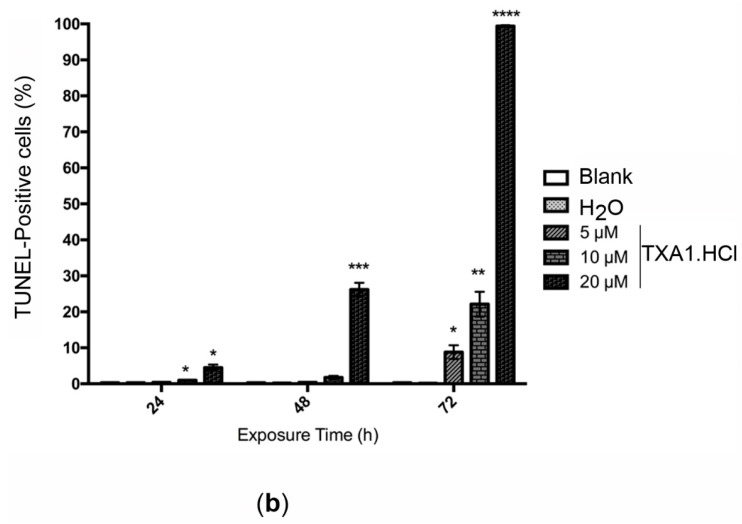
Figure 5.
Effect of TXA1·HCl treatment in MCF-7cell death, analyzed with the TUNEL assay. Cells were treated for 24, 48 and 72 h with medium only (Blank), H2O and TXA1·HCl (5, 10 and 20 µM). (a) Representative fluorescence microscopy images showing increasing TUNEL-positive cells (green) as induced by 5, 10 or 20 µM of TXA1·HCl, while few or no TUNEL-positive cells were observed in control cultures (Blank and H2O). DNA was stained with DAPI (blue); bar = 40 μm; (b) Quantification of the levels of cell death. Results are the mean ± SEM from at least three independent experiments. * p ≤ 0.05; ** p ≤ 0.01; *** p ≤ 0.001; **** p ≤ 0.0001 when comparing treatment vs. control (H2O).


