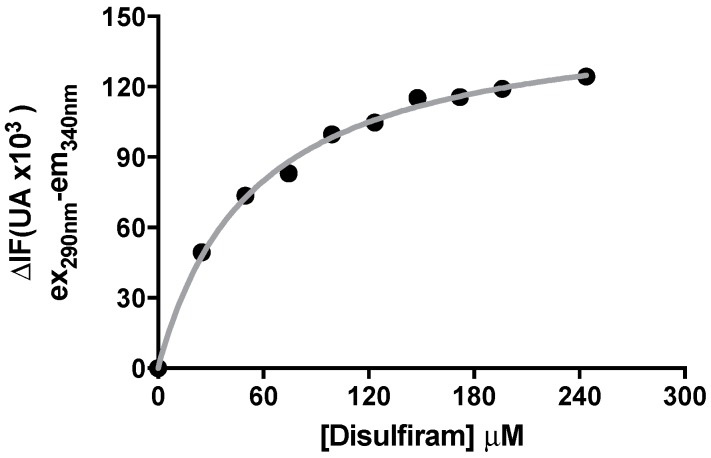
Figure 4.
Binding of DSF to C. vulgaris urease at equilibrium. The change in the intrinsic fluorescence (ΔIF) was measured an hour after the addition of the indicated concentrations of DSF. A non-linear curve fit to Equation (5) was made and is indicated by the solid grey line. Curve data is obtained in one of three identical binding saturation experiments. Non-linear curve fitting and plots were prepared using Graph Pad Prism 5®.

