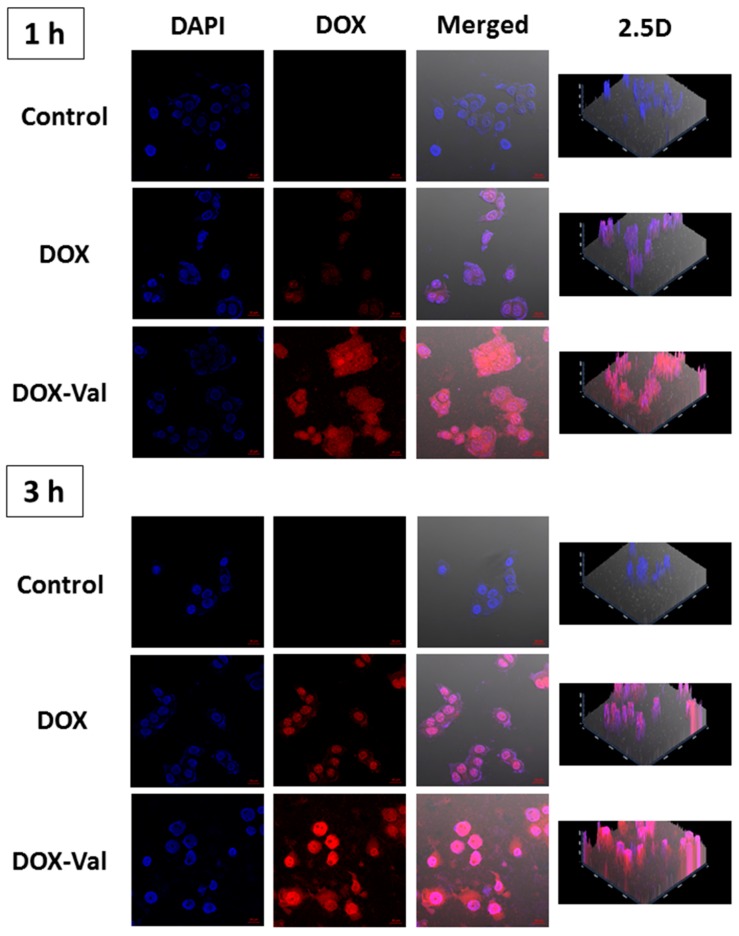
Figure 3.
Cellular distribution of DOX and DOX-Val in MCF-7 cells observed by CLSM. DOX and DOX-Val (10 μM) were incubated for 1 h and 3 h in MCF-7 cells. Red and blue colors indicate DOX and 4′,6-diamidino-2-phenylindole (DAPI), respectively. DAPI, DOX, merged, and 2.5 D images are presented. The 2.5 D image can provide spatial information between 2D and 3D images. The length of the scale bar in the image is 20 μm.

