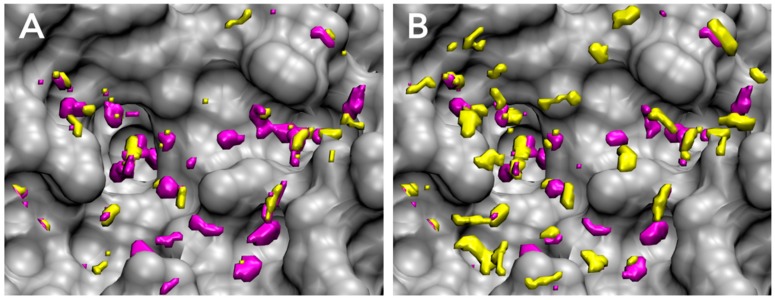
Figure 5.
Enthalpy-entropy decomposition of unfavorable water distributions for GIST-based desolvation function in the active site of FXa (gray): (A) pose parameter set; (B) affinity parameter set. More enthalpically unfavorable water regions are shown in purple (), whereas more entropically unfavorable water regions are shown in yellow (). Figure prepared by using VMD [57].

