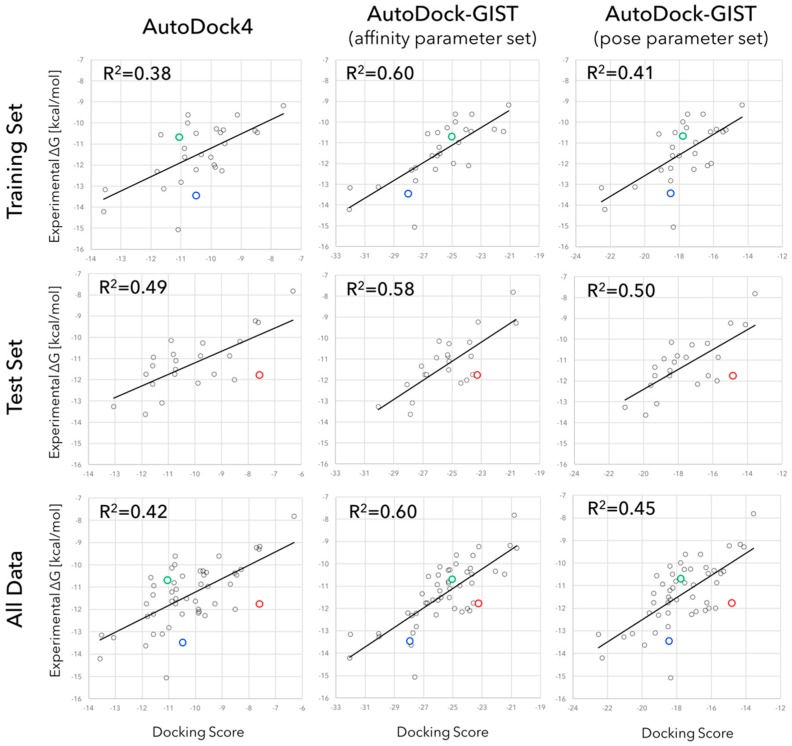
Figure 6.
Scatter plots and regression lines of experimentally measured binding affinities versus docking scores of AutoDock4 (left), AutoDock-GIST with affinity parameter set (middle), and AutoDock-GIST with pose parameter set (right) for FXa ligands of training set (upper), test set (middle) and all data (lower). R2 values represent the squares of Pearson correlation coefficients. Color plots show specific examples of improvements: blue, green, and red circles represent the ligands of 1FJS, 2J34, and 2Y5F, respectively.

