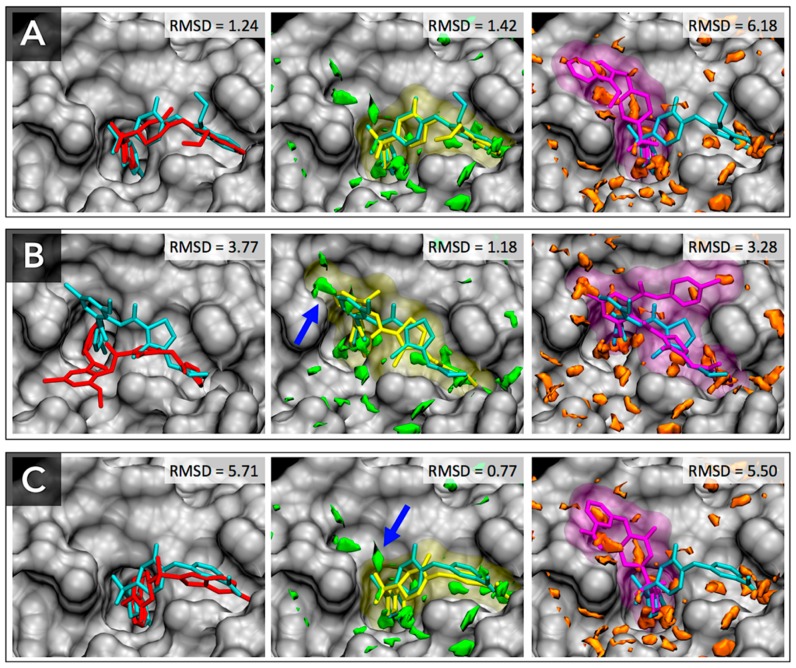
Figure 7.
Docking results for FXa ligands of PDB entries: (A) 1NFX, (B) 1MQ6 and (C) 1NFU. Native crystallographic structures of bound ligands are shown as cyan sticks. Docking results of AutoDock4 are shown as red sticks (left), those of AutoDock-GIST with the pose parameter set are shown as yellow sticks and transparent surface (middle), and those of AutoDock-GIST with the affinity parameter set are shown as purple sticks and transparent surface (right). The unfavorable water distributions for the pose parameter set and the affinity parameter set are shown as green and orange regions, respectively. The blue arrows point to unfavorable water molecules which contribute to the successful docking. Figure prepared by using VMD [57].

