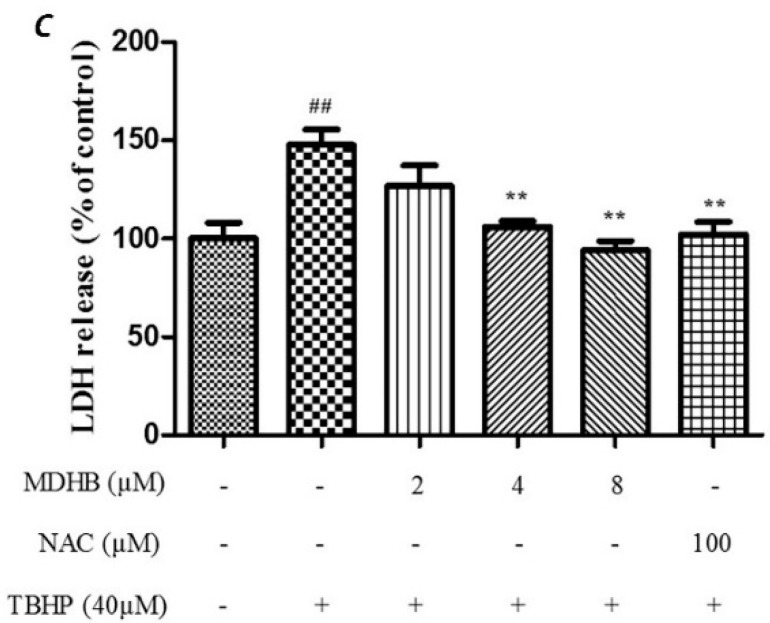
Figure 1.
The effect of different concentration of MDHB on TBHP-treated SH-SY5Y cells by MTT assay and LDH assay. (A) The safety margin of MDHB. Cell viability was measured by MTT assay. SH-SY5Y cells were cultured with MDHB at 2~128 μM and 0.1% DMOS for 24 h. Data were normalized by control group. Values represent means ± S.E.M (n = 4); * p < 0.05 versus the TBHP-treated alone group (n = 4); (B) The cells were pretreated with 2, 4, or 8 μM of MDHB for 4 h, followed by treatment with 40 μM TBHP for 24 h. Cell viability was measured using the MTT assay. Data are normalized to the control group. Values represent means ± S.E.M. ## p < 0.01 versus the control group. ** p < 0.01 versus the TBHP-treated alone group (n = 4); (C) Cells were pretreated with 2, 4, or 8 μM of MDHB for 4 h, followed by treatment with 40 μM TBHP for 24 h. LDH release was measured. Data are normalized to the control group. Values represent means ± S.E.M. ## p < 0.01 versus the control group. ** p < 0.01 versus the TBHP-treated alone group (n = 4).


