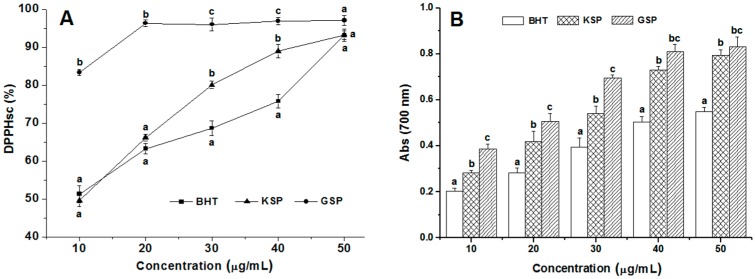
Figure 3.
DPPH free radical scavenging (A) and ferric reducing antioxidant power (B) effects of the KSP in comparison with grape seed polyphenols (GSP) and butyl hydroxy toluene (BHT). Bar with the different letters represent values that significantly different according to the Duncan’s multiple range test (p < 0.05). Vertical bars represent the standard error from the means of three separate tests.

