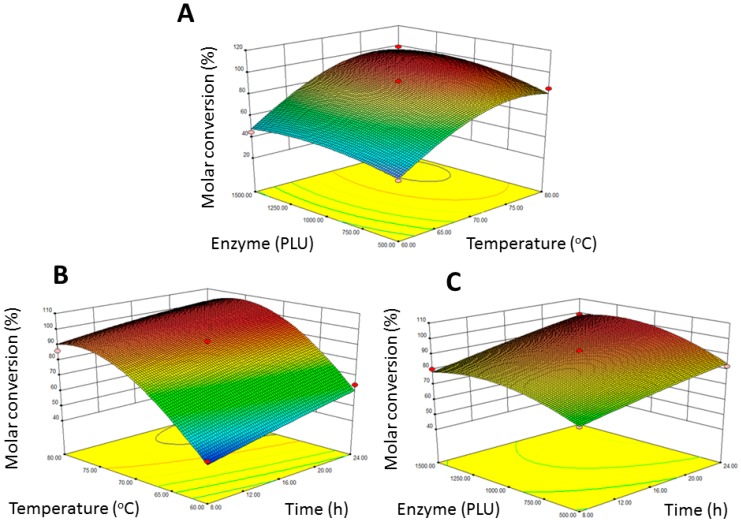
Figure 1.
Response surface plot for the relationships between molar conversion and experimental variables. Response surface plot showing the relationships between molar conversion of 2-ethylhexyl ferulate and reaction parameters: (A) reaction temperature and enzyme amount; (B) reaction temperature and reaction time and (C) reaction time and enzyme amount.

