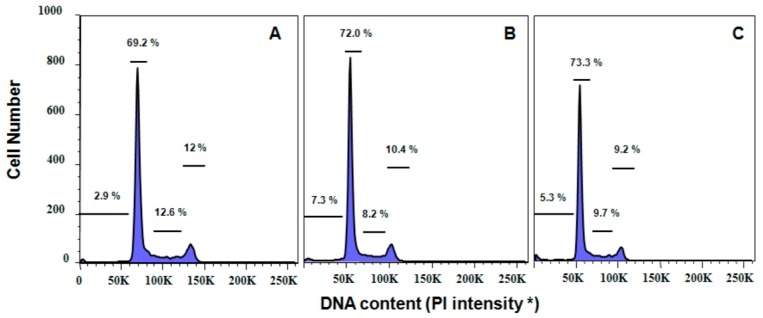
Figure 4.
Cell cycle DNA histograms of HeLa cells treated with PBS (Panel A); 4 mg/mL cultivated C. crispus extract (Panel B); and 4 mg/mL wild-harvested P. palmata extract (Panel C) at 24 h. Values represent (from left to right) the percentages of cells in Go, G1, S and G2M phases. * PI intensity, Propidium iodide in arbitrary units of fluorescence intensity.

