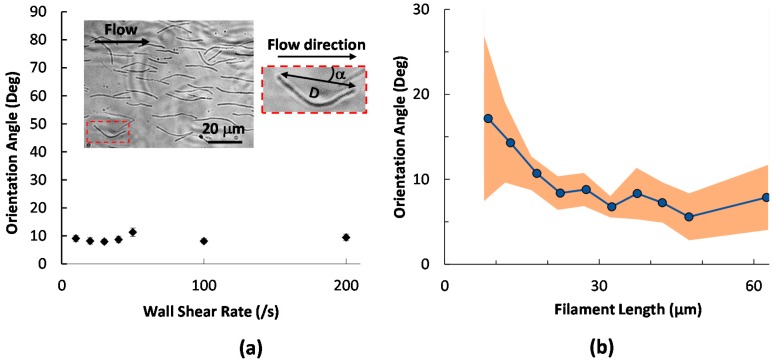
Figure 2.
Initial alignment of adhered filamentous cells with flow. (a) Orientation angle as a function of wall shear rate. Each data points shows mean orientation angle with standard error measured from 75–100 filaments. The left image in the inset shows typical alignment immediately after adhesion. The filament in the red box is zoomed in and showed as the right inset. Parameters characterized in this paper include filament length, the orientation angle, i.e., the absolute value of the angle between the two end points and the flow (α), and the end-to-end distance (D); (b) Initial orientation angle as a function of filament length. The dots are averages of the absolute end-to-end angles in 10 bins as described in the text. The shaded area represents 95% confidence interval of the mean. The line connecting the dots is to guide the eye.

