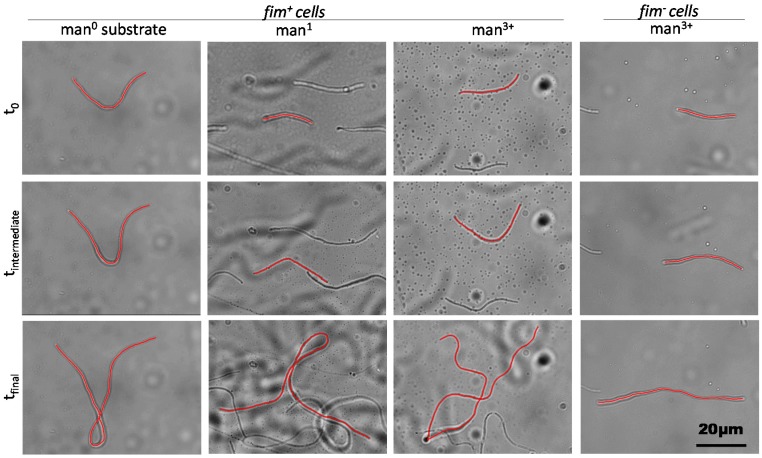
Figure 3.
Time-course imaging of filamentous cells in microfluidic channels with varied mannosylation. Representative images show filamenting cells in the same field of view at the initial time point (t0), an intermediate time point (tintermediate, ~20 min) and after elongation ceased (tfinal). Cells were either fimbriated (fim+) or non-fimbriated (fim−) and attached to substrates with no mannosylation (man0), monomeric mannose (man1), or oligomeric mannose (man3+). Red lines trace single cells tracked over time and remaining in the field of view throughout the time course.

